↳AMAZON · WORLDWIDE OPERATIONS · THE SHORT VERSION
Amazon could move a parcel faster than a person.
Moving one employee to a new job took forty-eight days. Here is what we did about it.
Amazon’s warehouses employ over a million people. I designed the software they are found, promoted and moved with. Before it, all of that ran on spreadsheets and email.
- Role
- UX lead · end to end
- Team
- PM · Eng · Science · HR
- Timeline
- Within Amazon · 2019–24
- Outcome
- <24h · $10M+ annual
How much time do you have?
START WITH THE COMPARISON
Same company. Two very different clocks.
Order something from Amazon. It is at your door tomorrow.
Ask to move jobs inside that same company. Eight people have to approve it.
Forty-eight days, on average, to move one person.
The company that invented next-day delivery took seven weeks to move somebody upstairs.
WHY IT TOOK SO LONG
The request had to go and find its own story.
Performance in one tool. Mobility in another. Succession in a spreadsheet somebody emailed you.
Forty systems, none of them talking.
So a manager’s real job became copying between them. Not leading. Routing.
40SYSTEMS · 8 APPROVALS · 1 MOVE
NOW MULTIPLY IT
This wasn’t happening to one person.
1,000,000+
PEOPLE IN THE WORKFORCE
Across 1,842 buildings, each with its own private definition of a “critical role”. Nobody could add the numbers up honestly.
WHAT WE BUILT
One record that follows you, and three products that use it.
Everything about you, in one place.
One record instead of forty, changing shape depending on who is looking.
You stop having to be somebody’s friend.
You used to get found because a manager knew you. Search opened the whole company.
See the gap before it becomes a crisis.
Who might leave, who is ready, and who replaces your biggest site lead if they go.
And then the move itself, in one click.
Spots the shortage, ranks who fits, handles the approvals. Forty-eight days became a button.
AND THEN SOMETHING NOBODY EXPECTED
Half the organisation. A seventh of the successors.
“Rise showed that women were 48% of my organization but only 15% of identified successors, and then showed us who was already performing at the next level.”VP, DELIVERY OPERATIONS
Nobody had decided this. It was just invisible until something made it visible.
WHAT HAPPENED
Forty-eight days became one click.
to fill a role, down from forty-eight days.
saved every year, ongoing.
manager hours a month, handed back.
It shipped fully accessible. A tool that decides whose career moves has to work for everyone it decides about.
That’s the story. There’s more underneath it.
↳AMAZON · WORLDWIDE OPERATIONS
The Talent Ecosystem
What I was hired to do, how I led it, and what changed as a result.
- Role
- UX lead · end to end
- Team
- PM · Eng · Science · HR
- Timeline
- Within Amazon · 2019–24
- Outcome
- <24h · $10M+ annual
How much time do you have?
START HERE
If you have never worked inside a company this size.
Amazon Worldwide Operations is the warehouses, sorting centres and delivery stations. More than a million employees across 1,842 buildings — the largest part of the company by headcount, and almost none of it sitting at a desk.
The people who run those buildings, the regional leaders above them, the HR partners who advise them, recruiters, and the employees whose careers were being decided.
Every large employer has to do three things with its own people: find them, grow them, move them. At this scale all three ran on spreadsheets emailed between forty separate tools.
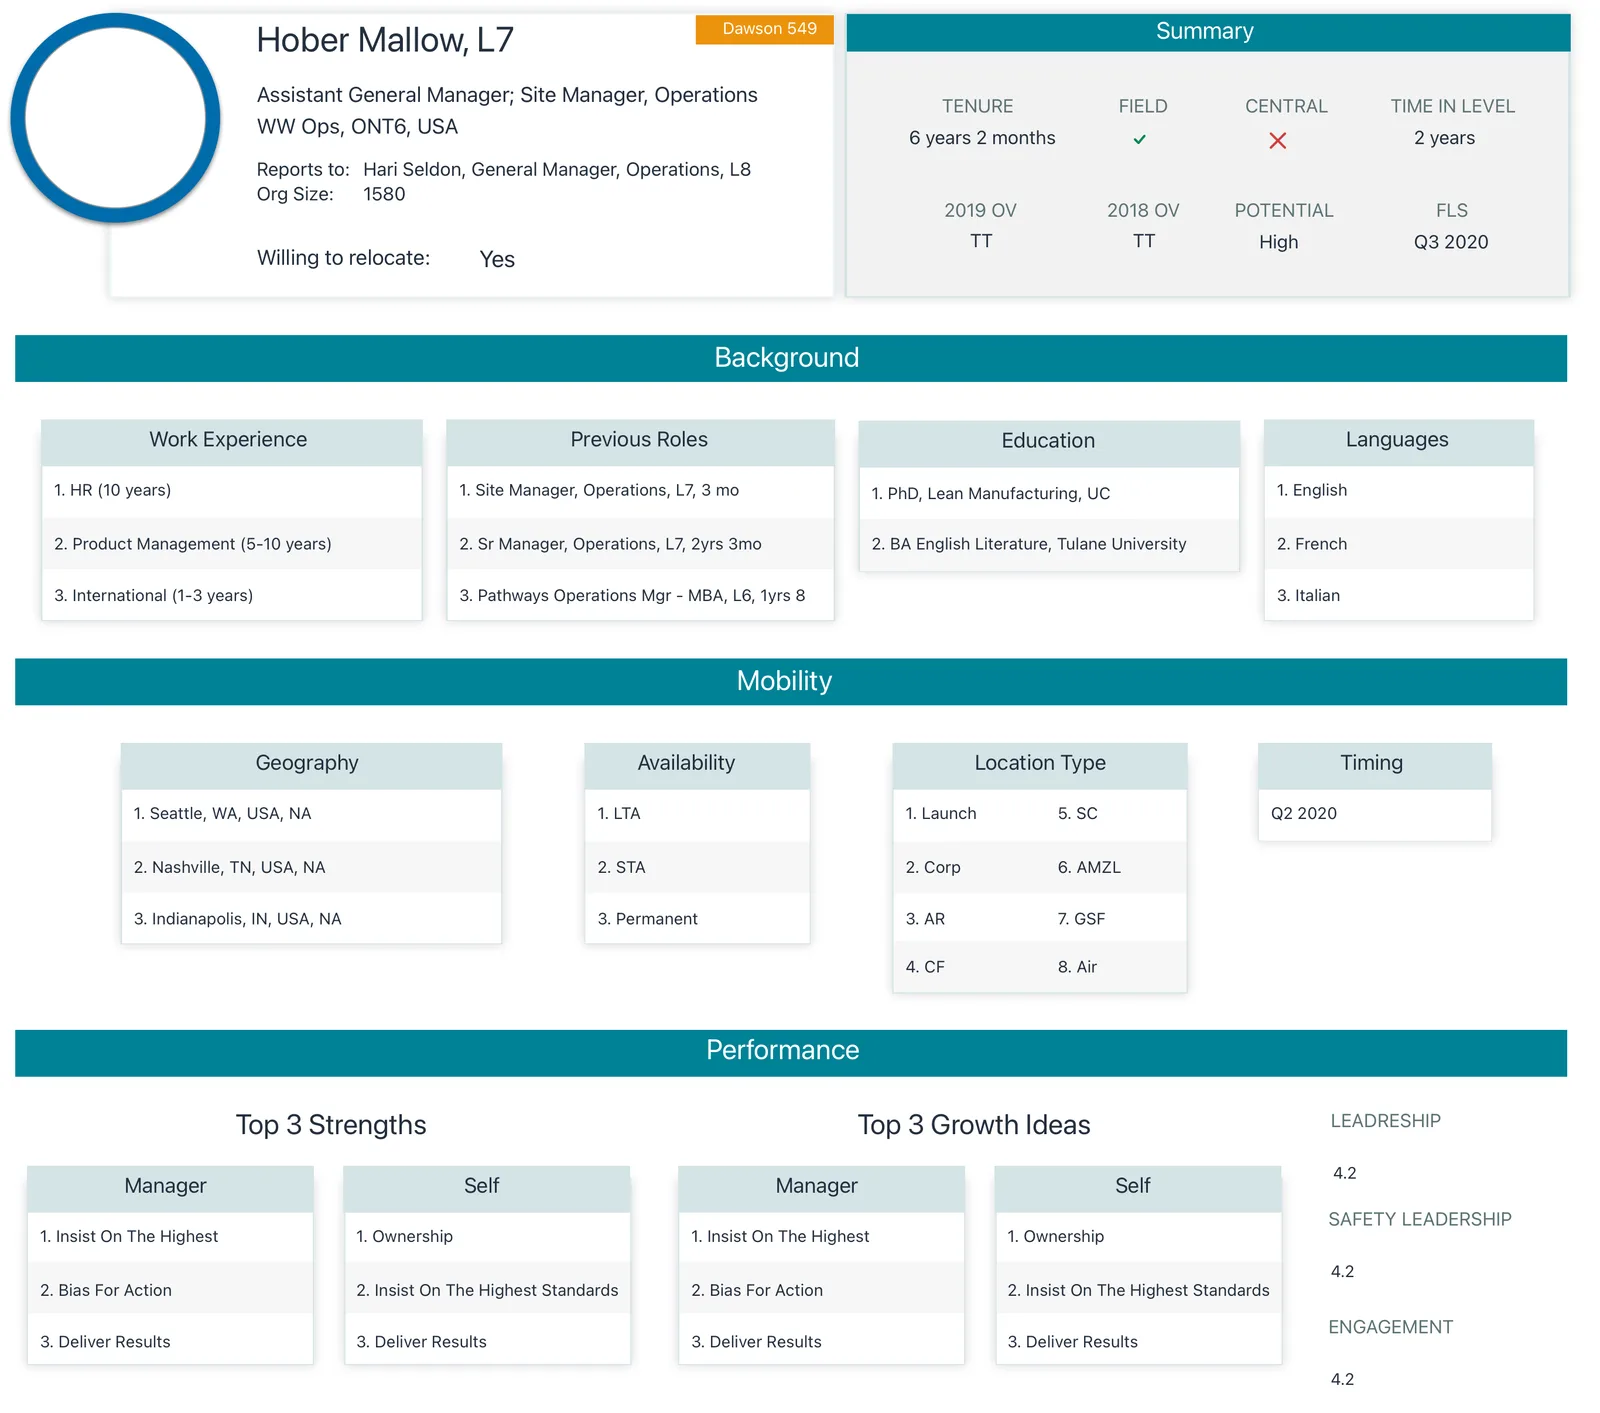
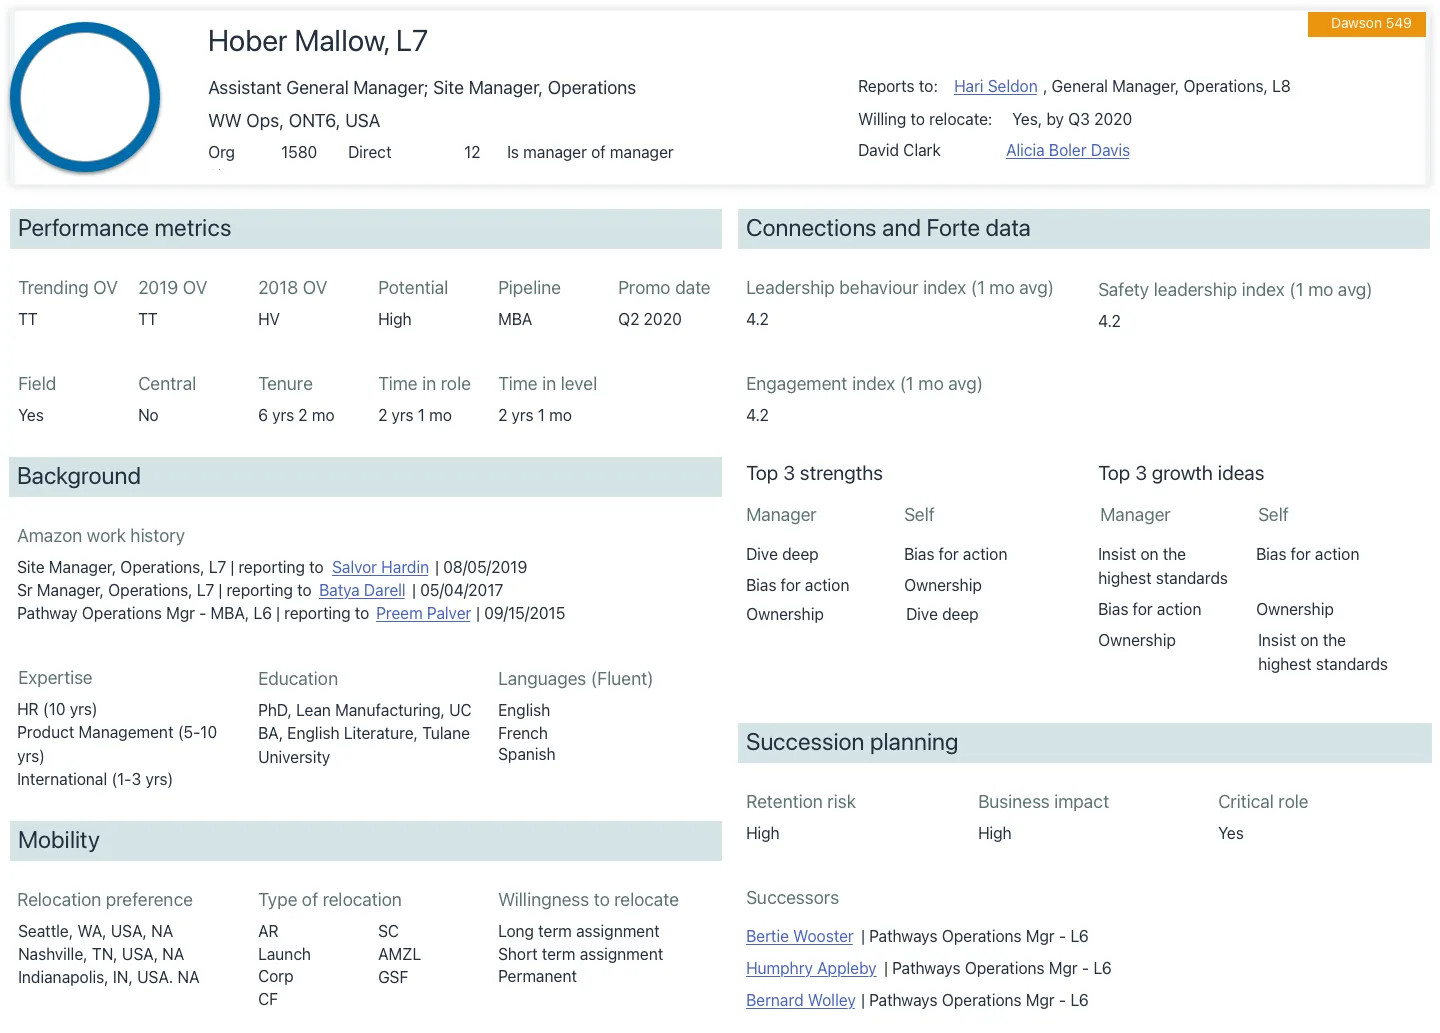
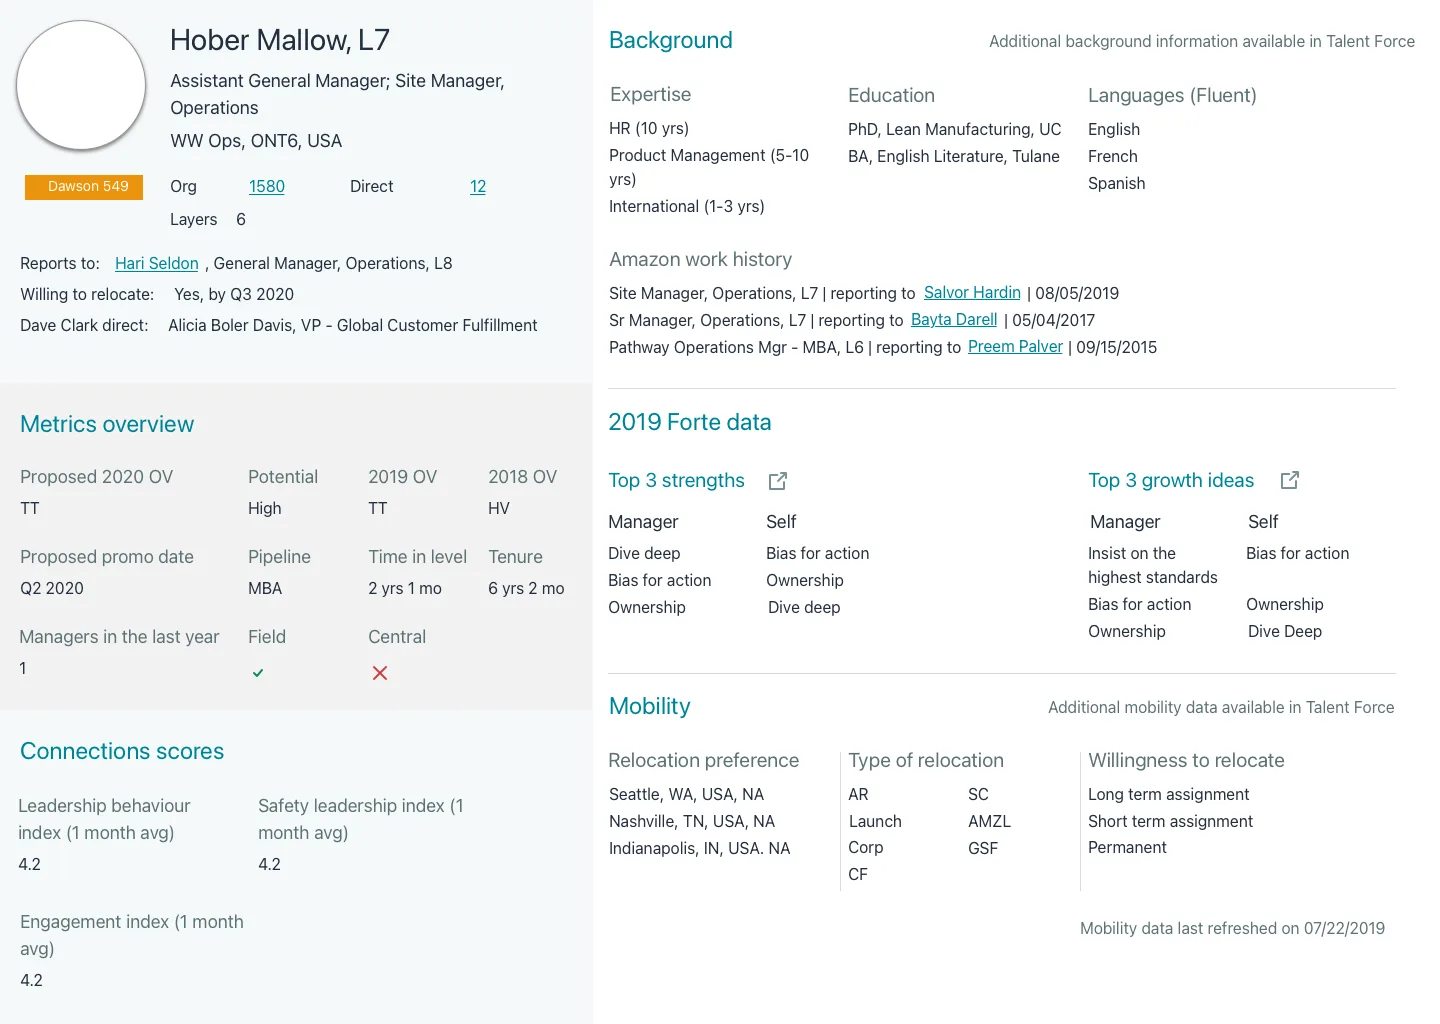
One page holding everything known about one employee.
A search engine for the workforce, not just your own contacts.
Who might leave, who is ready to step up, who would replace whom.
The transfer itself: spot the shortage, match a person, approve.
THE NETWORK
1,842 buildings. A parcel crossed them in hours. A person took 48 days.
After Fluid, a person crosses them in under 24 hours.
A parcelA person changing jobs
01 · AT A GLANCE
Forty-eight days, reduced to under twenty-four hours.
Managers weren’t leading. They were copying data between forty systems by hand.
02 · SCOPE OF THE ROLE
What I owned, what I shaped, and who with.
I OWNED05
I SHAPED05
I WORKED WITH05
03 · HOW I LED
Research the same question in four seasons.
Staffing needs change completely between the holiday peak and the quiet months, so a single round of interviews would have frozen a brief that was never stable. I went back across four seasonal cycles. The same question asked in January and July got different answers, and both were true.
Make the vocabulary a product requirement.
1,842 buildings each meant something different by “critical role” and “retention risk.” You cannot add up numbers that mean different things in different places, so the words had to be settled first. Defining them stopped being a research note and became something we shipped.
Design one record that four products share.
The Talent Profile became the smallest shared piece: one permission-aware record that appears as a full page, a summary card, a side panel or a small chip. Same truth, four shapes, which is what let four teams move independently without drifting apart.
Ship without a design system by writing one.
There was no design system to build on, and launch could not wait for one. I carried the work into the build with a specification for every page — sizes, spacing, states, behaviour — settled directly with engineers, then brought in line with the company’s HR design standards as the products matured.
04 · RANGE, IN ARTIFACTS
Concept exploration through production spec.
Eight pieces of the actual work, labelled by the kind of thinking each one needed. Click any of them to view full size. Arrow keys move through the set.
RESEARCH
PRODUCTION
05 · FOUR PRODUCTS, ONE RECORD
Found, grown, moved, without rebuilding the story.
Recordings come from the working prototypes, with sample data. Names and figures in them are fictional.
TALENT PROFILE · THE RECORD
One record that travels with you.
Full page, summary card, side panel, small chip — the same truth in four shapes, showing only what the viewer is allowed to see, edited in place and correct everywhere at once.
40 → 1 SYSTEMS PER DECISION
TALENT SEARCH · FOUND · FINDING PEOPLE
A search engine for opportunity.
Hiring ran on who a manager already knew, which meant it ran on bias. Search made all 1M+ employees findable — within the limits of what each viewer is allowed to see.
1M+ DISCOVERABLE
RISE · GROWN · PLANNING AHEAD
Succession, before it’s urgent.
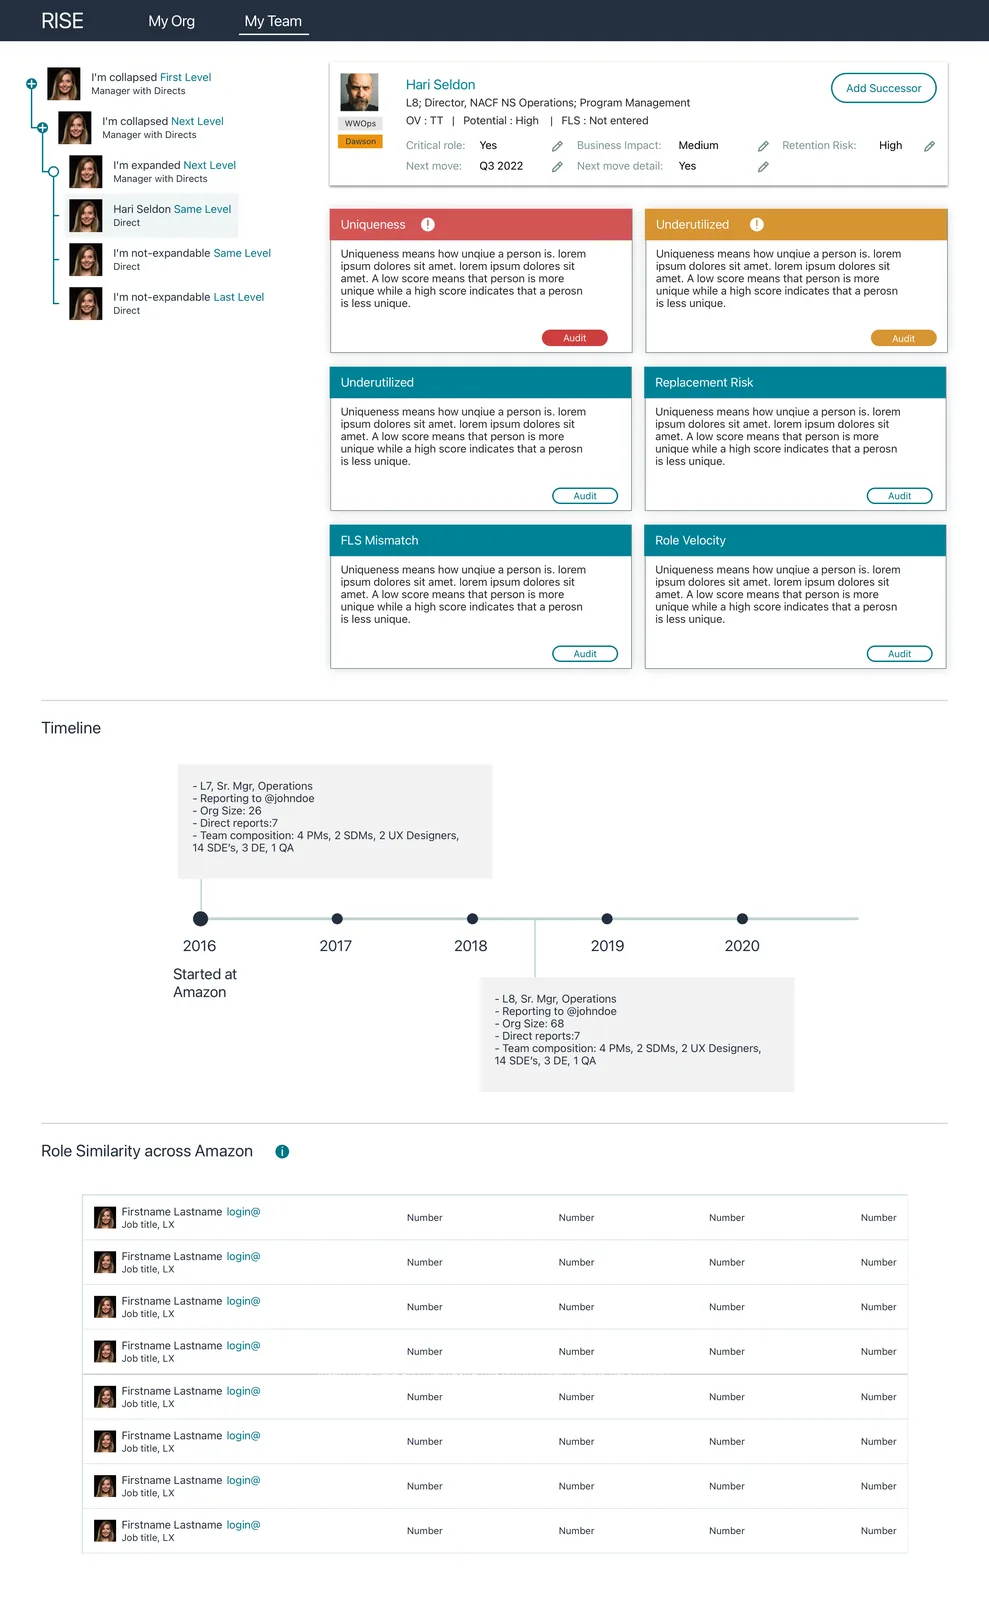
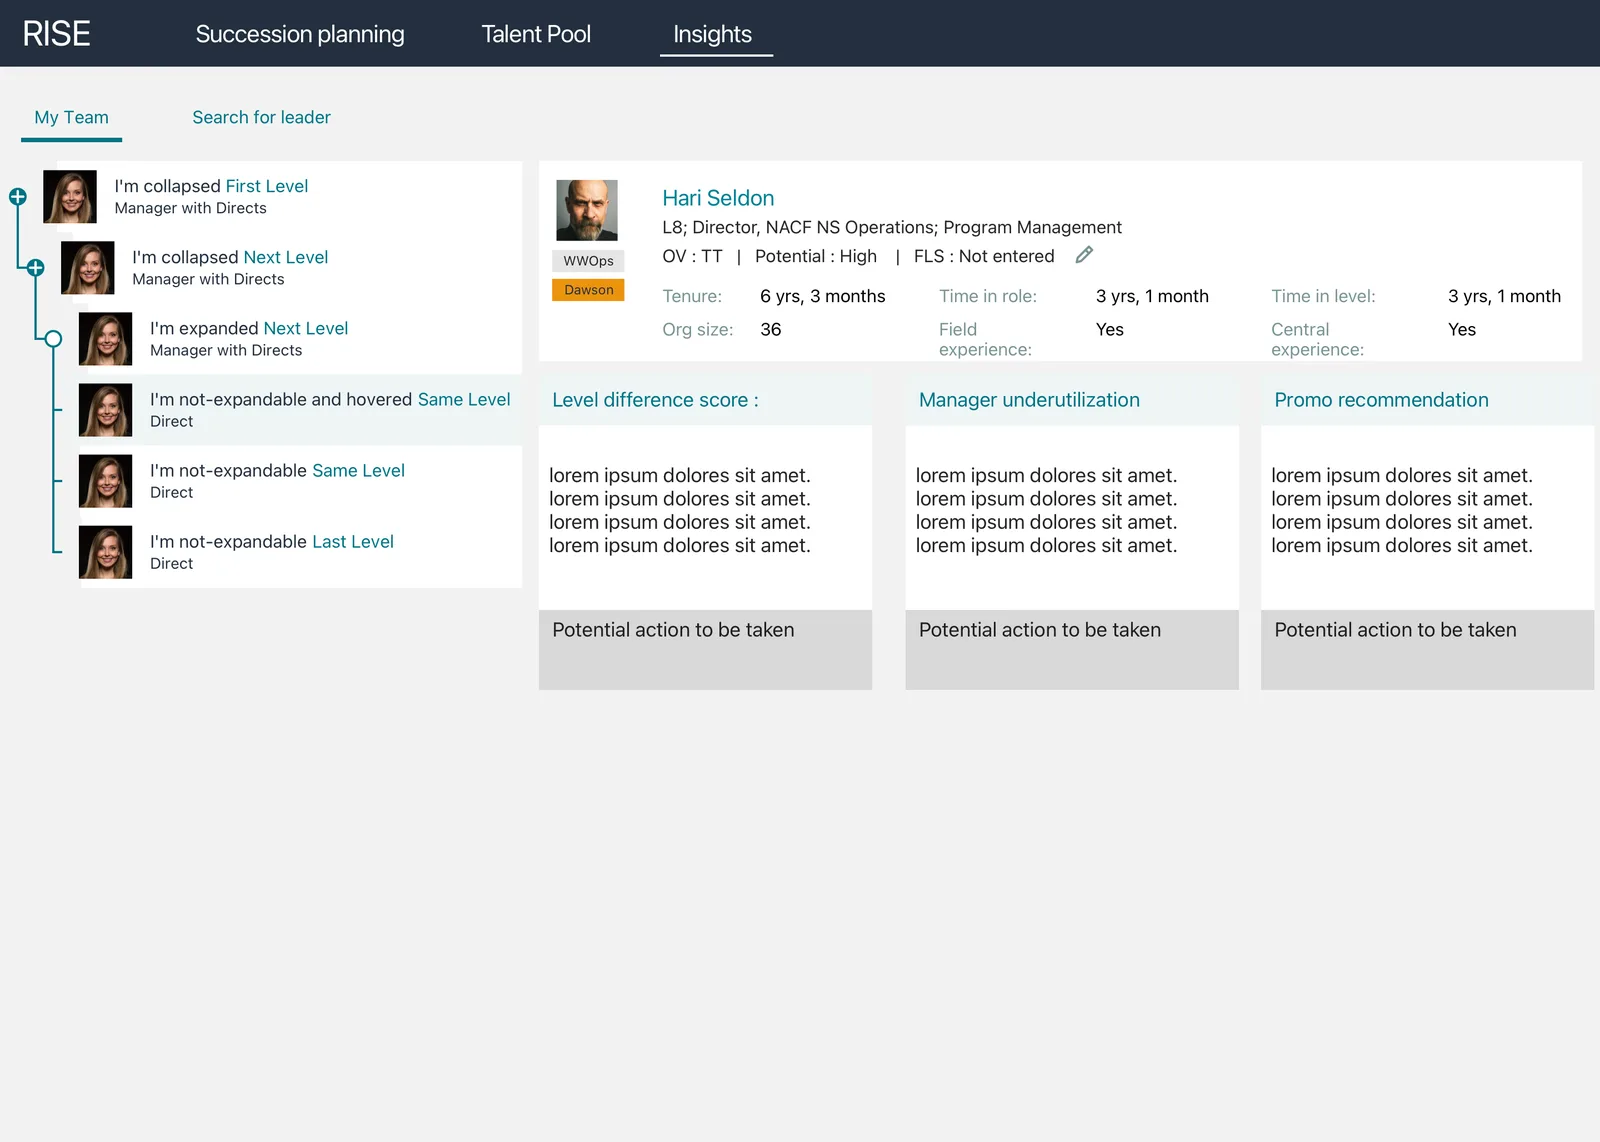
Who might leave and who is ready to step up, kept live instead of reconstructed once a year — including a score for how hard someone would be to replace, built with Amazon’s research scientists.
BIAS SURFACED, NOT ASSUMED
FLUID · MOVED · MAKING THE MOVE
The one-click transfer.
Spots which buildings are about to run short, ranks the people who fit the opening, and handles the paperwork that used to need eight separate approvals.
48 DAYS → UNDER 24 HOURS06 · OUTCOMES
<24hto fill a role, down from 48 days
$10M+saved every year, ongoing
700+hours saved for managers monthly
90%+of eligible leaders chose to use it within three months
100%usable by keyboard and screen reader, checked element by element
Where these numbers come from. Transfer time and manager hours were measured by the WW Operations programme team against a pre-launch baseline; the run-rate saving was signed off by Finance. Adoption is the share of eligible leaders who used the tools without being told to, over the first three months. The accessibility figure is my own element-by-element audit, re-run at each release.
The number I would defend first is the accessibility one. A system that decides who gets found, grown and moved has to work for everyone it decides about. So we checked it the slow way, element by element: that every control can be reached without a mouse, that focus moves in a sensible order, that every image and icon has words behind it, and that nothing is signalled by colour alone.
07 · WHAT I’D DO DIFFERENTLY
Three things I got wrong.
Every number above is real. So is this. Four greenfield products for a million people did not run clean. Two of these are versions of the same mistake — I assumed other people lived inside this software the way my team did. The third is about knowing when to stop.
-
01
I designed for my calendar, not theirs.
My team had Talent Search open every day, so we built as though finding people were a daily act. It isn’t. Leaders plan their orgs in bursts tied to the quarter, and between those windows there was no reason to open it. Adoption was slow, then moved sharply once the first planning cycle came round — which told me the product was right and my model of when it mattered was wrong. I now ask what a user’s year looks like before I ask what their screen should do.
-
02
I let “the most important thing” be settled too early.
Talent Profile is one page about one person, so it lives or dies on what earns a place on it. I found that out by asking — and the answer moved with who I asked. A site manager, an HR partner and a recruiter each named a different top three, so every time the research widened the page was rebuilt. The mistake wasn’t asking. It was treating “what matters most” as one answer I hadn’t found yet, rather than something that varies by role and should have been designed that way from the start.
-
03
I’d kill a good idea faster.
There was real appetite for a fifth product — Talent Pool, where anyone could assemble and keep their own group of people out of Talent Search. It was a reasonable idea, genuinely wanted, and would have been a fifth thing to staff, ship and maintain. We cut it back and folded the useful part into products that already existed. I still think that was the right call. I would just make it sooner: a request for a new product is usually a feature wearing a costume.
08 · WHERE THIS MAPS TO SENIOR SCOPE
If you’re hiring at staff or principal level.
Four brand-new products for a million-person workforce. No precedent inside the company, and no design system to build on.
Four teams shipping on their own schedules, all landing on one shared record. The joins between them were the actual design problem.
Product, engineering, research science and HR working to one plan, including an ongoing research partnership.
Succession planning had to be pitched to leaders who had run it from Excel for a decade before it could be designed at all.
I ran the user testing, the keyboard retesting and the element-by-element accessibility audit myself, then stayed through the build.
Want the reasoning, the research and the screens?
↳CASE STUDY · AMAZON · WAREHOUSES & DELIVERY
The Talent Ecosystem
Four products that changed how the world's largest workforce is found, grown, and moved, replacing 40 disconnected systems with one source of truth.
ROLEUX Lead · End-to-end
SCOPE4 products, built from nothing
TEAMPM · Eng · Science · HR
IMPACT$10M+ saved, every year
How much time do you have?
THE 60-SECOND READ
Fragmented operations.
One talent system.
Moving one person to a new job inside the company crossed eight approvals and forty disconnected tools, with their history retyped at every handoff. Promotion and movement had quietly stalled for more than a million employees across 1,842 buildings.
I led the research, the experience architecture, the product design and the usability testing, then the pixel-level specifications that carried four brand-new products into build, launch and use.
Four connected products replaced the forty. A move became a single click: 48 days down to under 24 hours. With 90%+ of eligible leaders choosing to use it in the first three months, and savings that repeat every year.
BEFORE WE START · THE SETUP
What this is, and who it was for.
Every large employer has to do three things with its own people: find them, grow them, move them. Nobody had built software for doing it a million at a time.
01 · The organisation
Amazon Worldwide Operations — the warehouses, sorting centres and delivery stations. Over a million employees across 1,842 buildings, and hardly any of them at a desk.
02 · The volume
88,000 hires and 22,000 internal moves in a single year. Constant, and at a scale no existing product was built for.
03 · How it ran
On spreadsheets, emailed between forty separate tools. A manager’s day was spent copying between them rather than deciding anything.
Site and org leadersThe people running one building, or one region of them. My primary users, and the ones losing mornings to spreadsheets.
HR partners & recruitersHR specialists attached to one part of the business, advising its leaders on hiring, promotions and departures.
Research scientistsAmazon’s in-house applied-science teams, who build statistical models for the business rather than for papers.
The employees themselvesThe group the decisions were about, and the group least consulted in how the old process worked.
One page holding everything known about one employee, in place of forty.
A search engine for the workforce, instead of a manager’s own contacts.
Who might leave, who is ready to step up, and who would replace whom.
The transfer itself: spot the shortage, match a person, approve once.
A note on the language
Corporate HR has a vocabulary of its own, and some of it is unavoidable in a case study about HR software. Any term with a dotted underline will explain itself if you hover or tap it, and the glossary below holds all of them in one place.
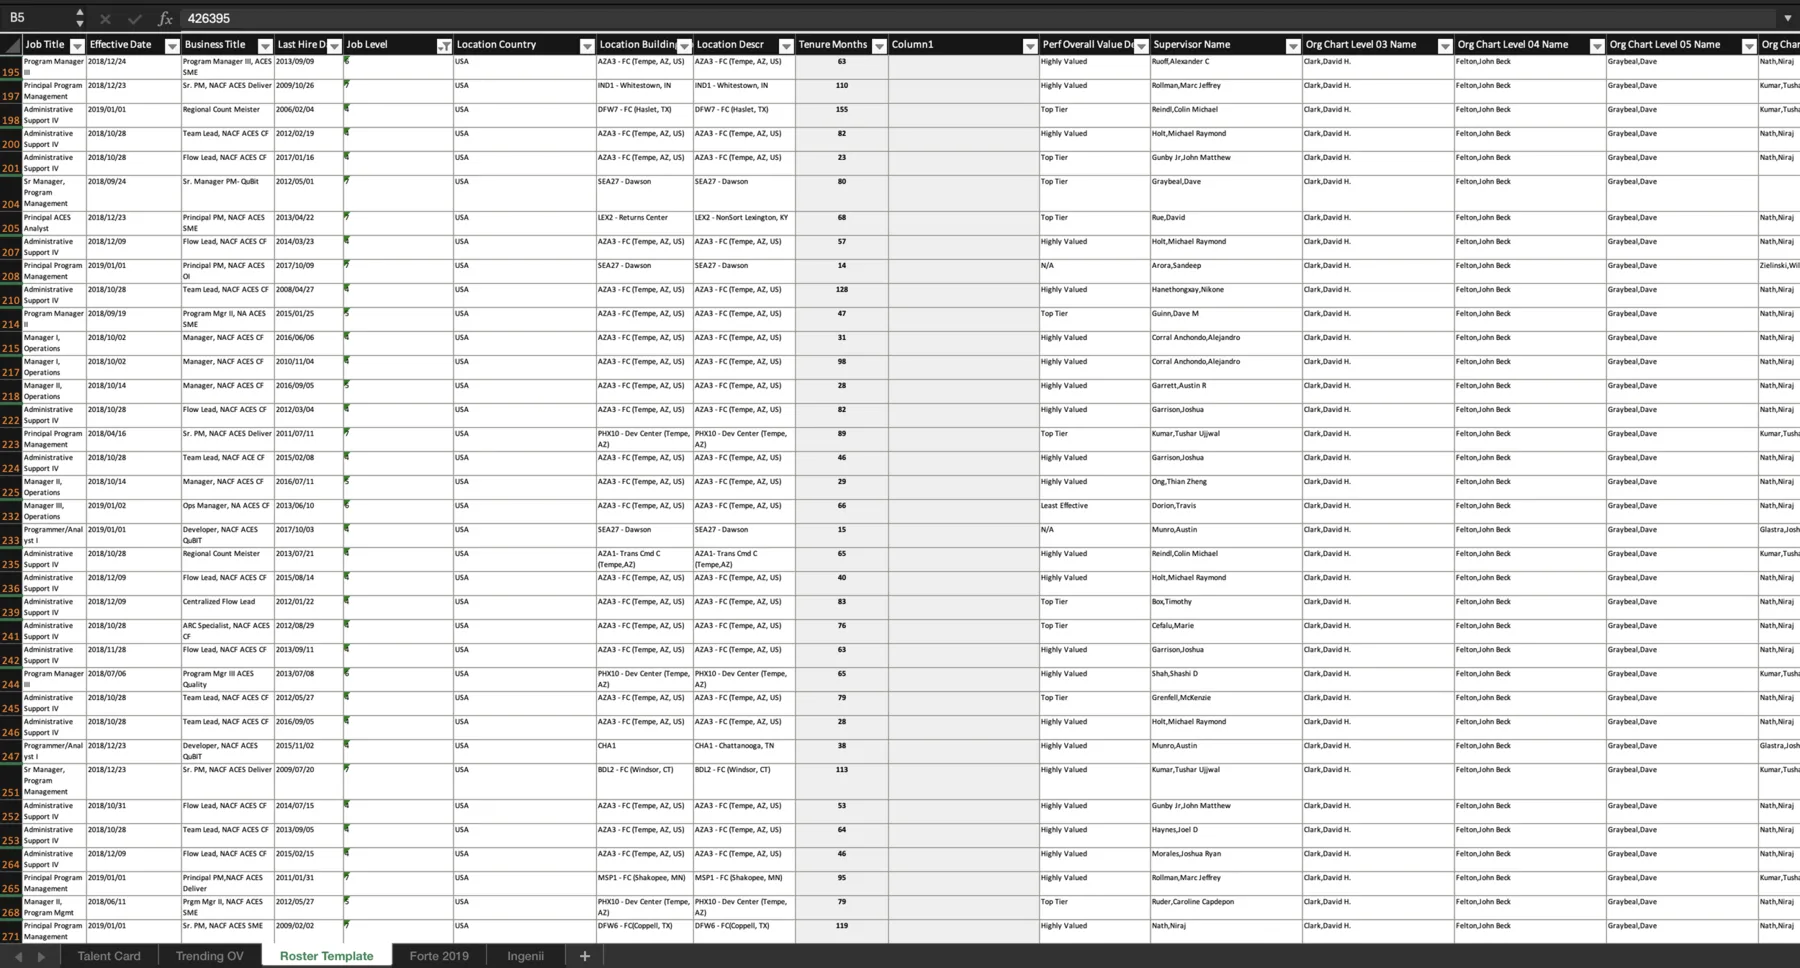
FW: FW: RE: RE: transfer approval needed
RE: RE: roster_v14_FINAL(2).xlsx
forwarded to program manager…
status: pending · system 23 of 40
2019ONE EMPLOYEE. ONE TRANSFER REQUEST.
48 days
One employee. One transfer request.
The same company delivers packages in 24 hours.
→REDESIGNED
Approve
Done in under 24 hours · one click · what I shipped
THE PROBLEM
88,000 hires and 22,000 transfers a year, managed in spreadsheets.
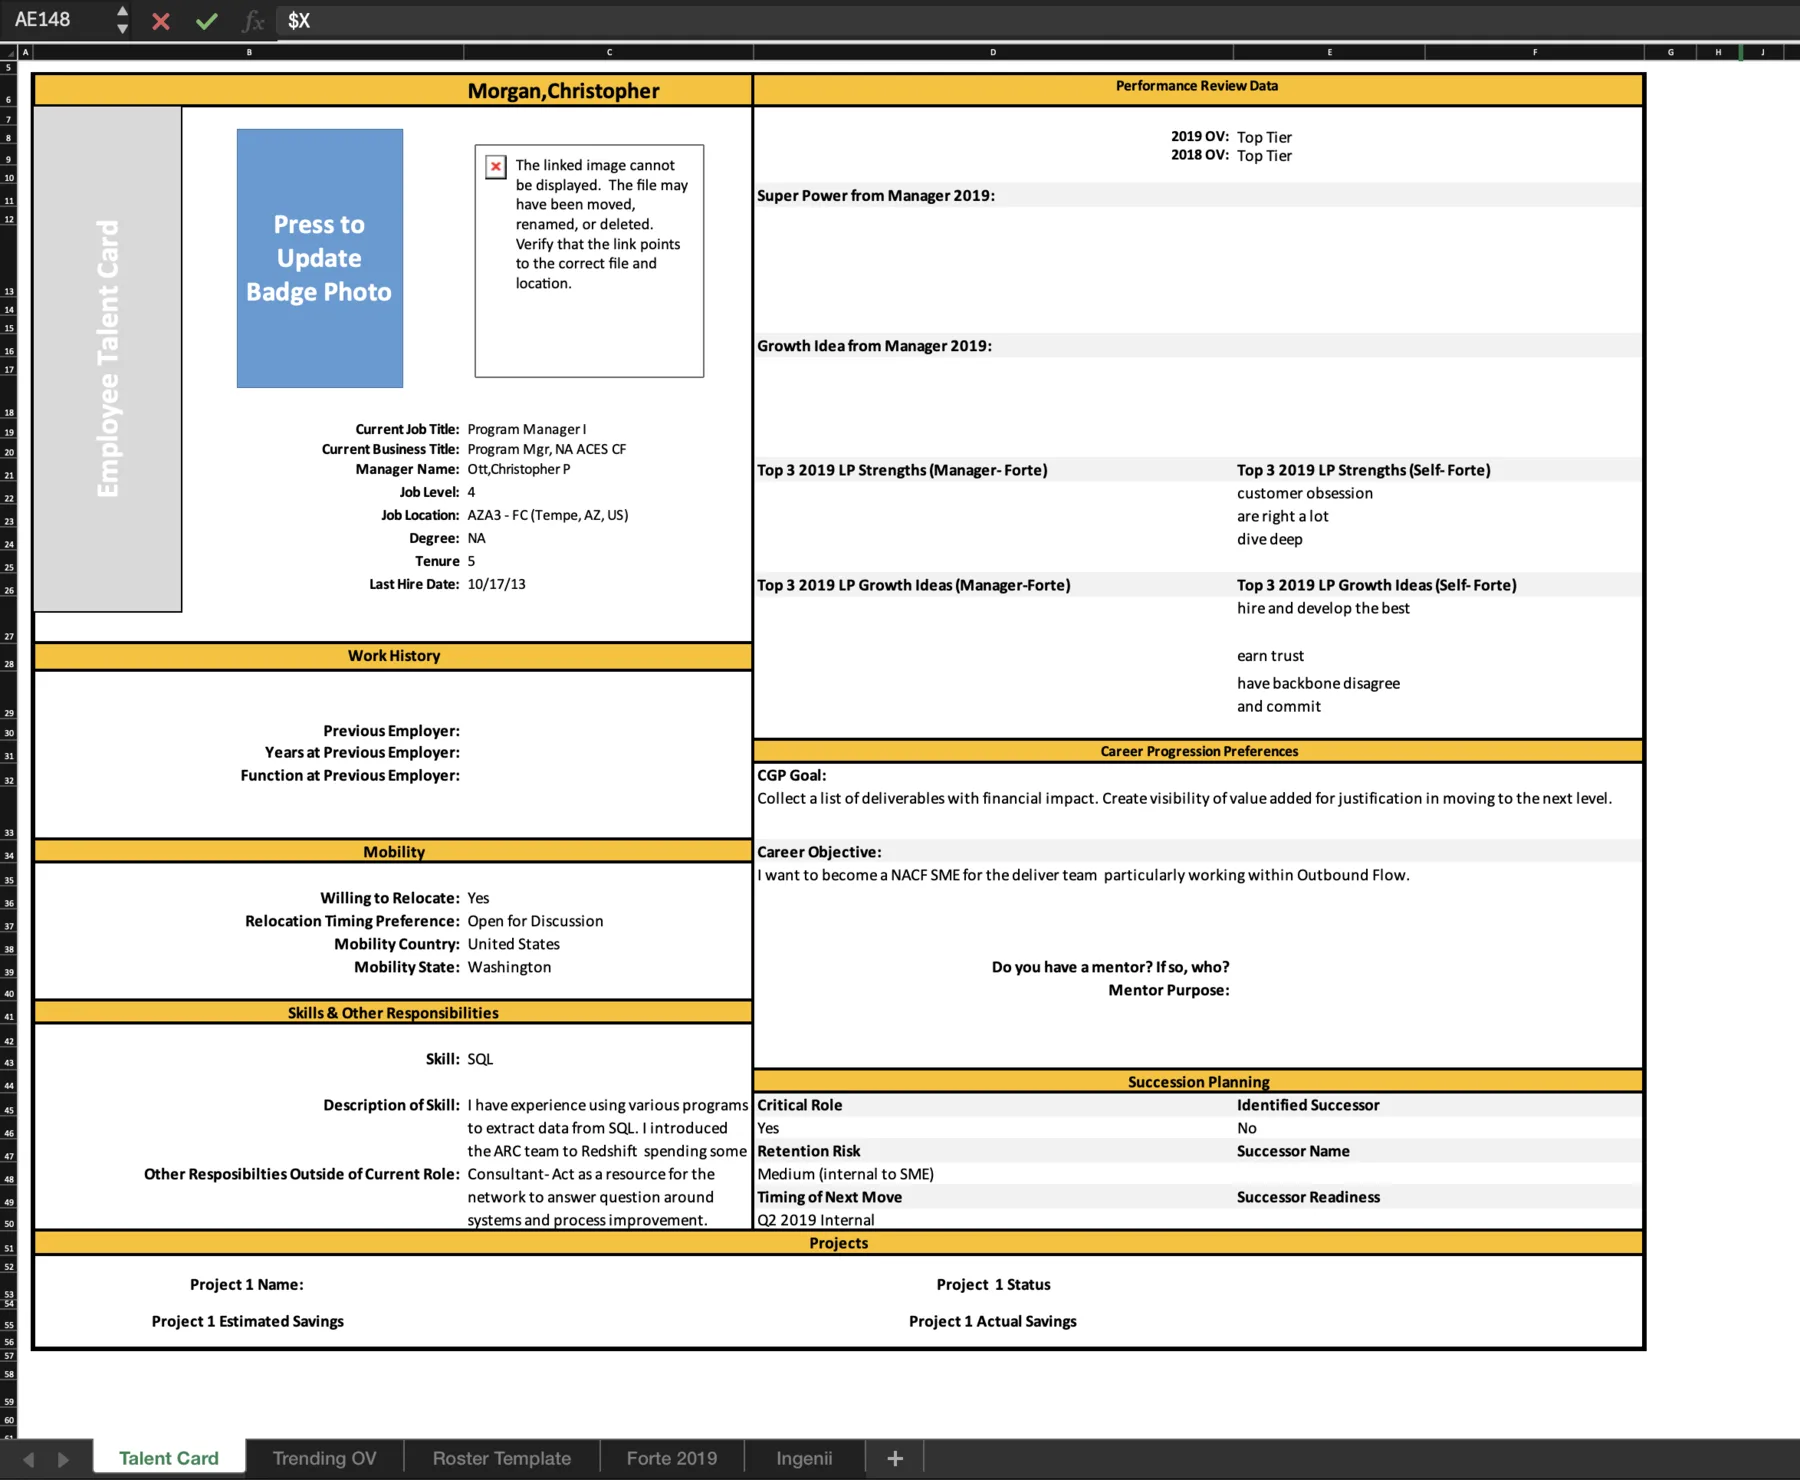
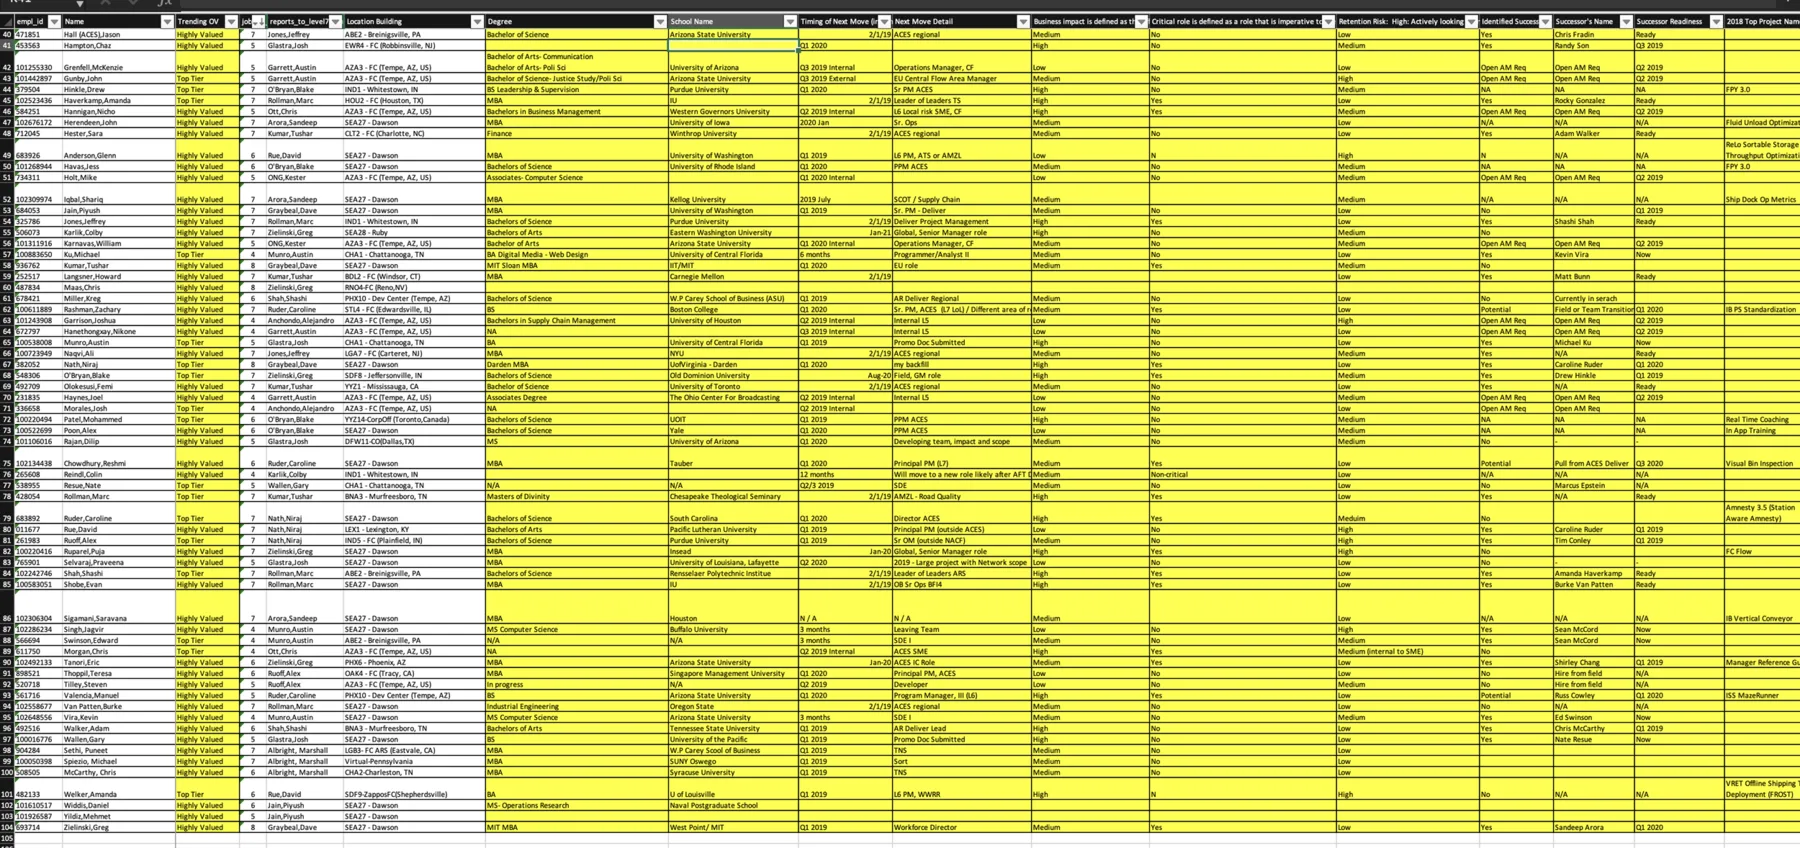
A single internal move required 8 approvals across 40 different systems. A manager opened one tool for performance reviews, another to see whether someone was willing to relocate, and emailed a program manager for the succession spreadsheet. Nothing carried from one to the next, so leaders became data routers: cross-referencing exported spreadsheets by hand to make decisions about people’s careers.
And with 1,842 buildings each defining “critical role” and “retention risk” differently, adding the numbers up honestly was impossible. The same word meant four things in four regions.
88KHires22KTransfers43KPromotions1.3KRecruiters
1 employee8 approvals · 40 systems
$1M+operational waste
8 approvals
40 systems
No source of truth
$1M+ operational waste
Welcome to Excel hell.
The most important data at Amazon, versioned by hand, different in every building.
THE RESEARCH
Months inside the machine.
I led 30+ interviews up and down the hierarchy: the managers running individual buildings, the leaders running regions, HR partners, recruiters, and the employees being moved. Then I sat in on the real meetings where people are planned and promoted, across four seasonal cycles, so the strategy tracked how conditions actually change instead of freezing one month’s view.
I synthesised it by grouping every observation until patterns appeared, then checking the patterns against each type of user in turn, and aligned product, engineering, research science and HR around the finding that defined the program: managers weren’t leading. They were acting as data routers between 40 systems.
WHAT THE RESEARCH CHANGED
The mess became three design laws.
I turned the research into an experience strategy the whole program could use. Every product decision could be tested against the same question: does this reduce the context a leader has to reconstruct by hand? Three laws aligned four product roadmaps without flattening their different jobs.
01 · CONVERGE
One truth, many contexts.
The same employee record had to work in a deep review, a quick search result, a side panel, and a planning card. The Profile became a portable data model instead of another destination.
02 · REVEAL
Context before density.
Leaders needed the signal first and the evidence second. Keeping detail one step away held the overview readable without losing the depth these decisions actually need.
03 · ACT
Put the action beside the insight.
Finding risk in one system and resolving it in another recreated the old problem. Search, planning, and movement actions therefore had to stay connected to the record that explained them.
The record
THE TURN, THE TALENT PROFILE
One atomic unit of truth.
I set the experience architecture around a set of products that talk to each other: built in pieces, tested separately, launched together. At its centre I defined the Talent Profile as the one shared record that follows an employee everywhere.
Four shapes, one truth. A full page for close reading, a summary card, a side panel, and a compact “baseball card”. The same record, rendered for the situation.
Permission-aware. Sensitive data stays restricted while everything else becomes open to anyone who needs it.
Always current. In-card editing with data persistence. Edit once, correct everywhere.
40 → 1SYSTEMS TO OPEN PER DECISION
ONE CONNECTED SUITE
One record. Found, grown, moved.
Recordings come from the working prototypes, with sample data. Names and figures in them are fictional.
The Profile is the single shared record every other product reads and writes. Follow the red line: the same record is found in Search, planned against in Rise, and acted on in Fluid. Nothing retyped, nothing lost between steps.
The record
Talent Profile
One record per person, four shapes for four situations, showing only what the viewer may see.
The unit of truth
Found
Talent Search
Any of the 1M+ can be found, not just the people a manager already knows.
Record → found
Grown
Rise
Who might leave, who is ready, and who takes over — settled before it is urgent.
Found → planned
Moved
Fluid
The move itself: the right people ranked for you, approved in a single click.
Planned → moved
Found
TALENT SEARCH
A search engine for opportunity.
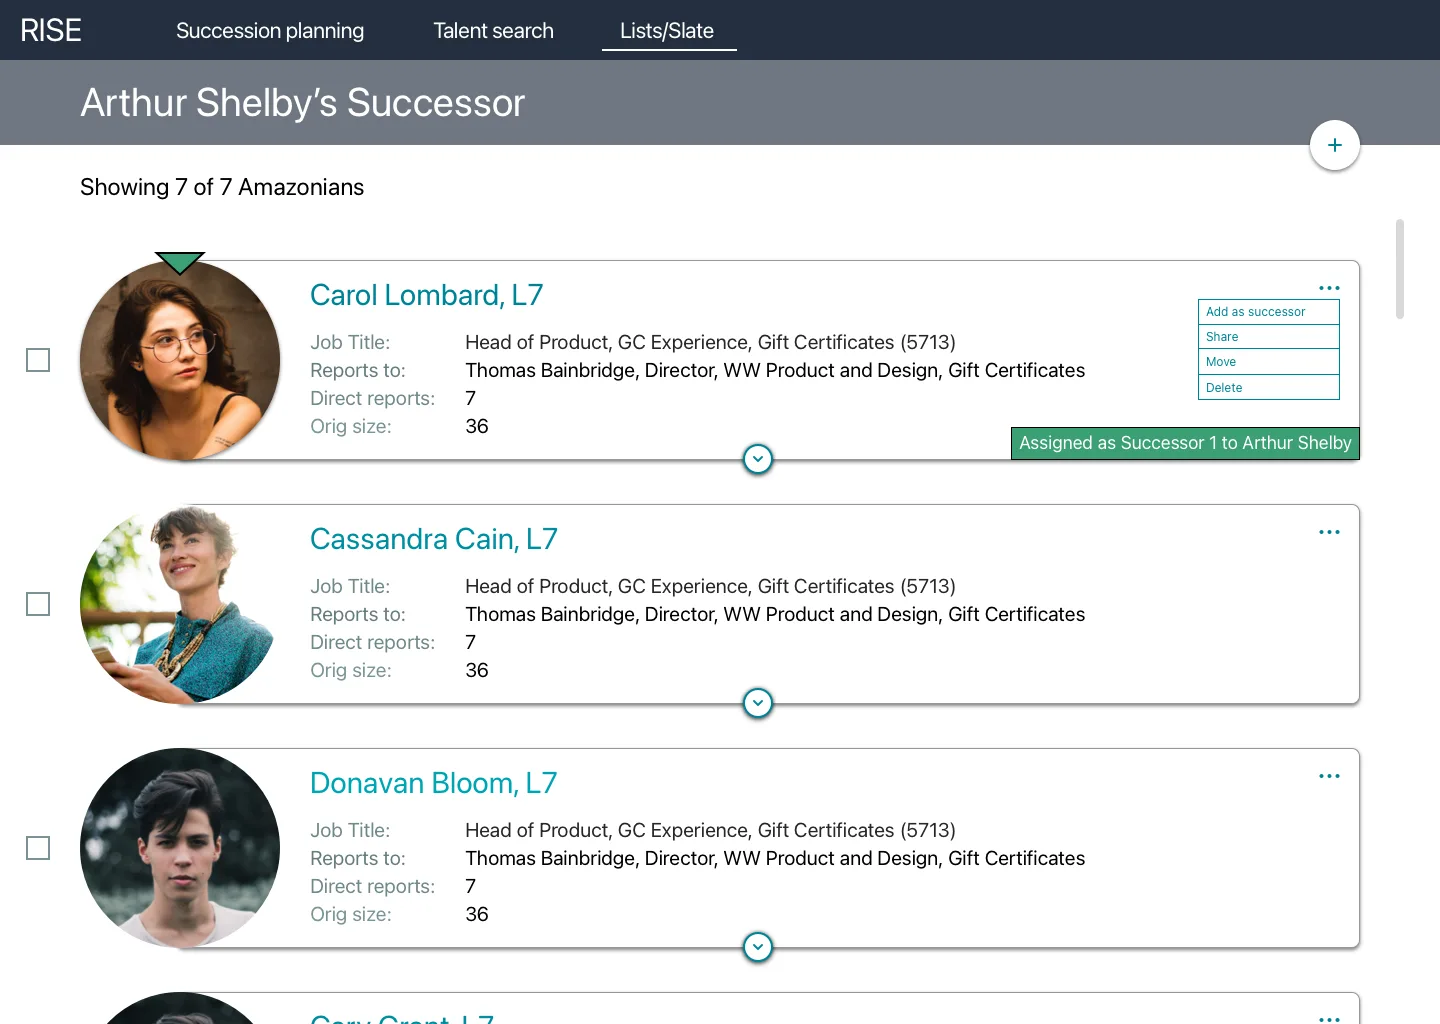
Hiring happened through who a manager already knew, which meant hiring happened through bias. Talent Search made all 1M+ employees findable, within what each viewer is allowed to see, by the things that actually matter: marked ready for promotion, willing to relocate to Nashville, doing a job similar to the one that just opened.
Privacy first. Access decided by job, not by person, so what a leader can see follows their role.
Available everywhere. Opened from inside any of the other products, reading and writing the same record rather than a copy.
Grown
RISE · PLANNING WHO GROWS AND WHO TAKES OVER
Succession, before it's urgent.
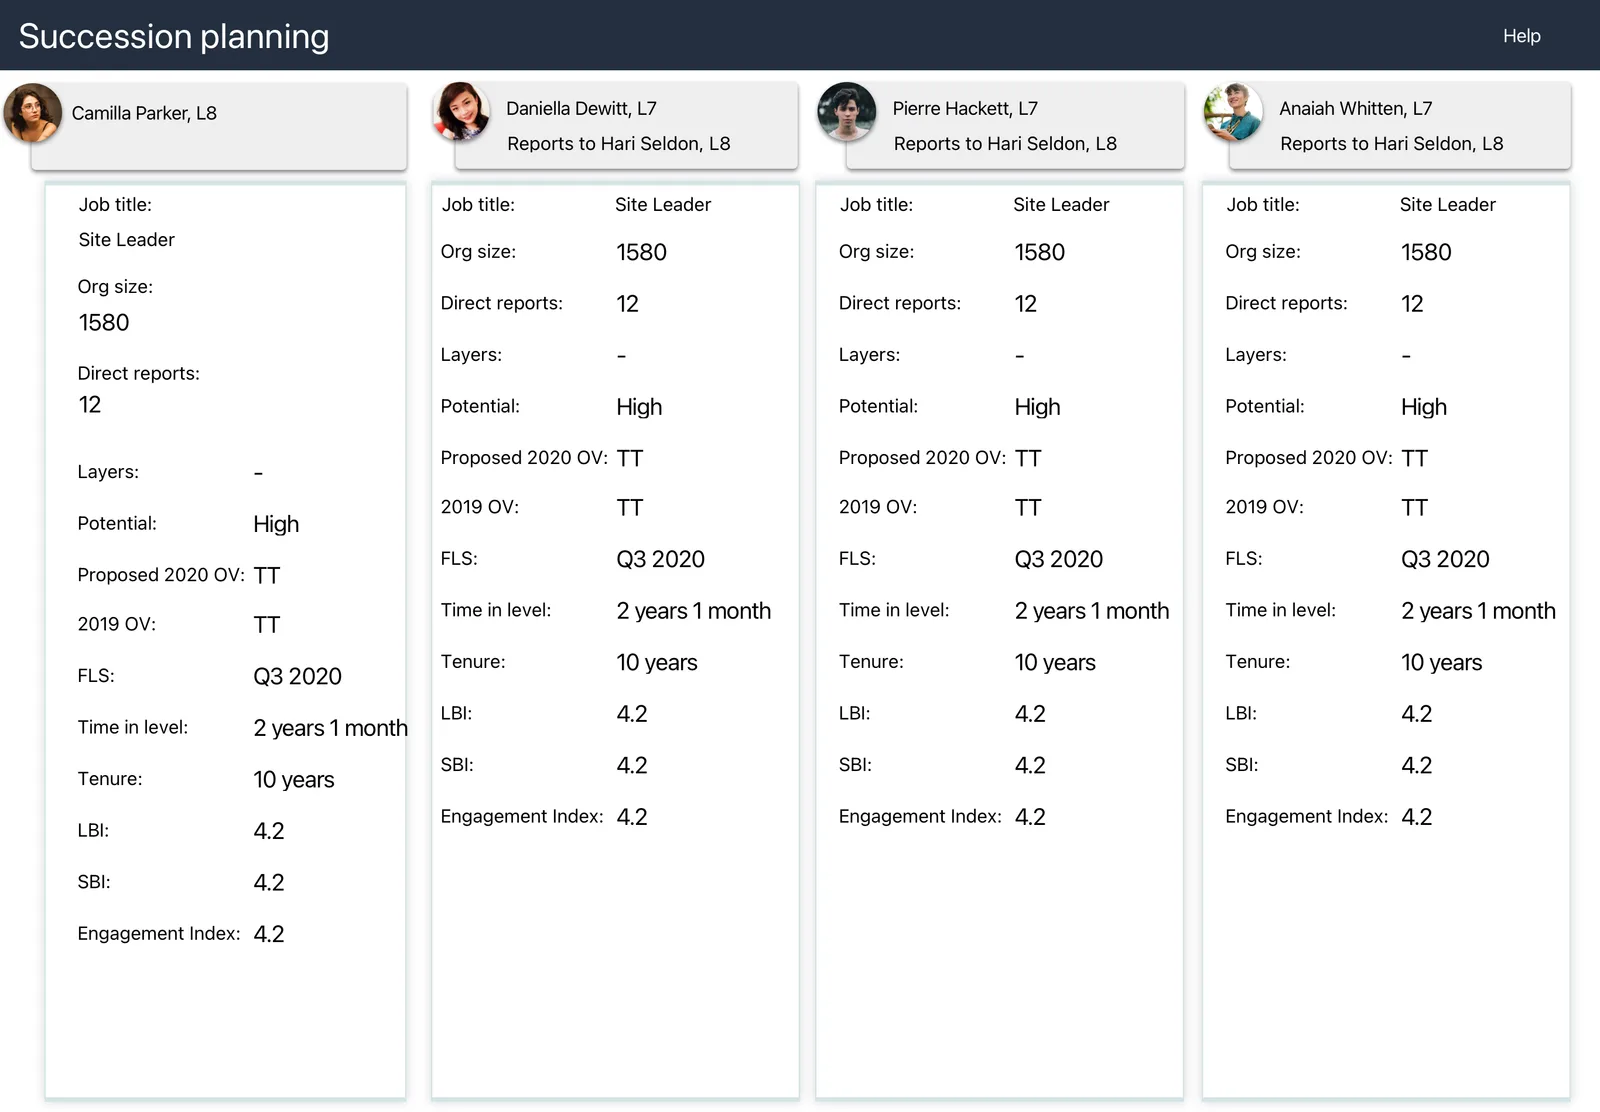
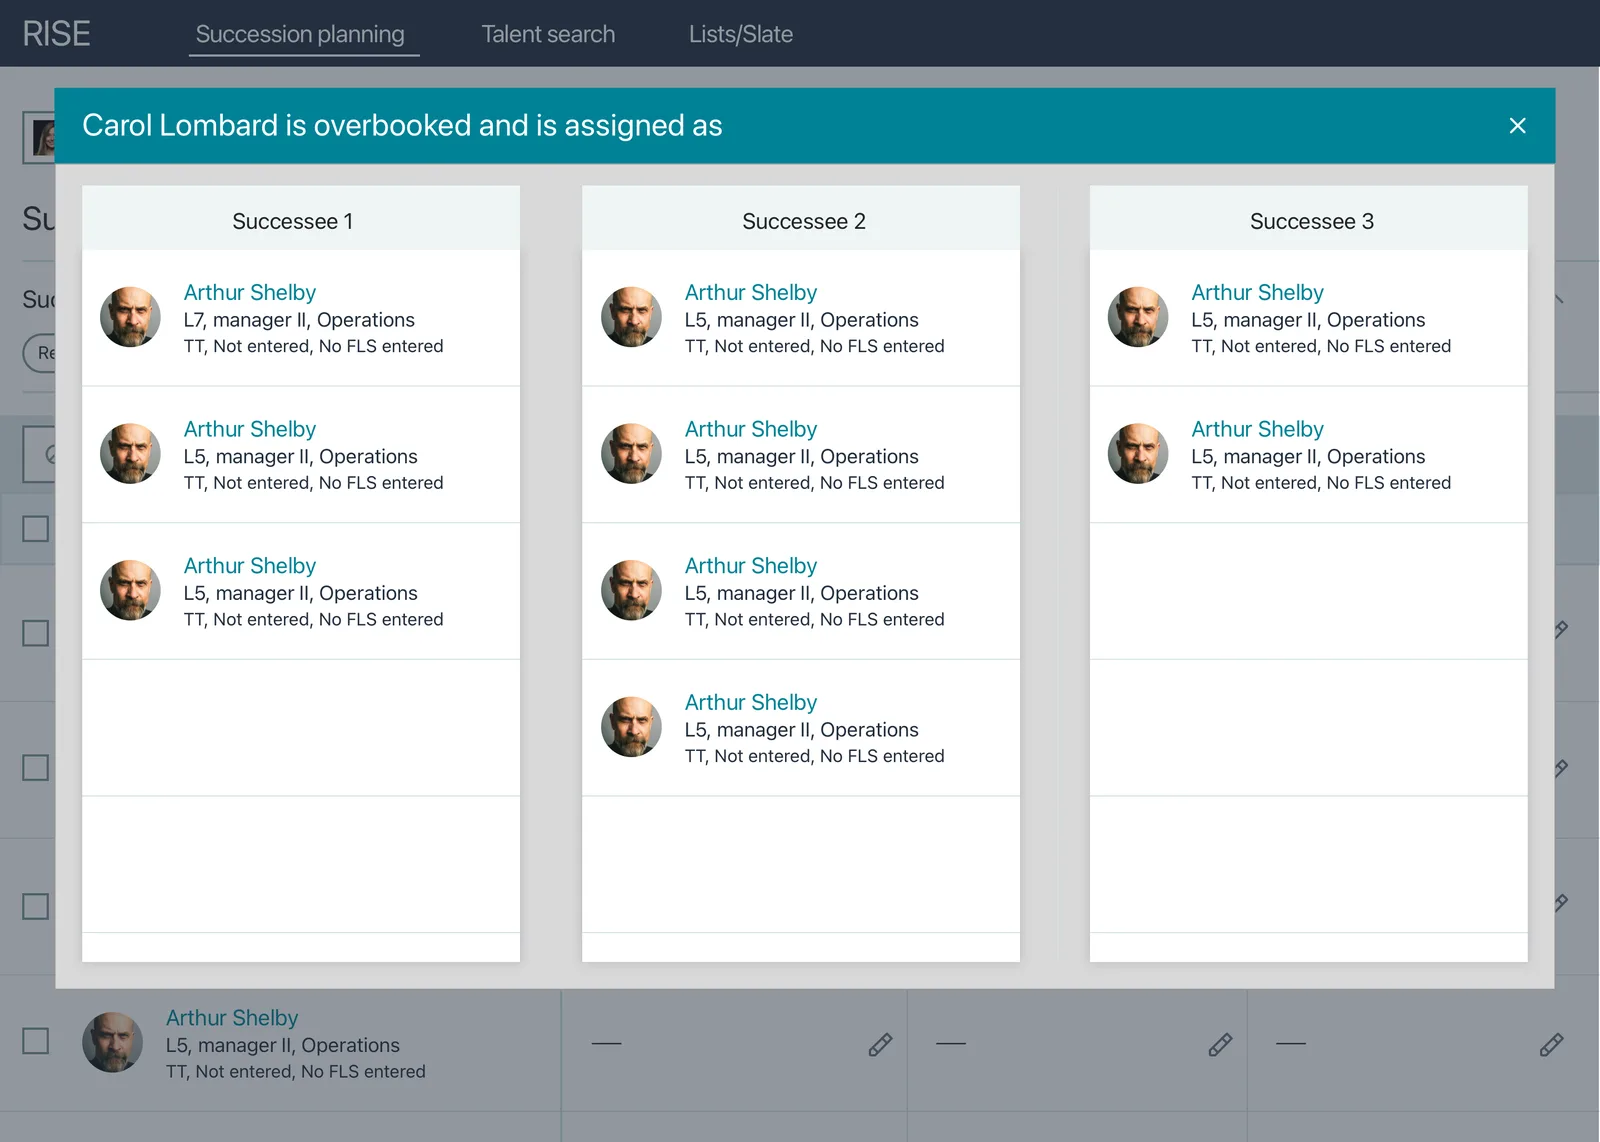
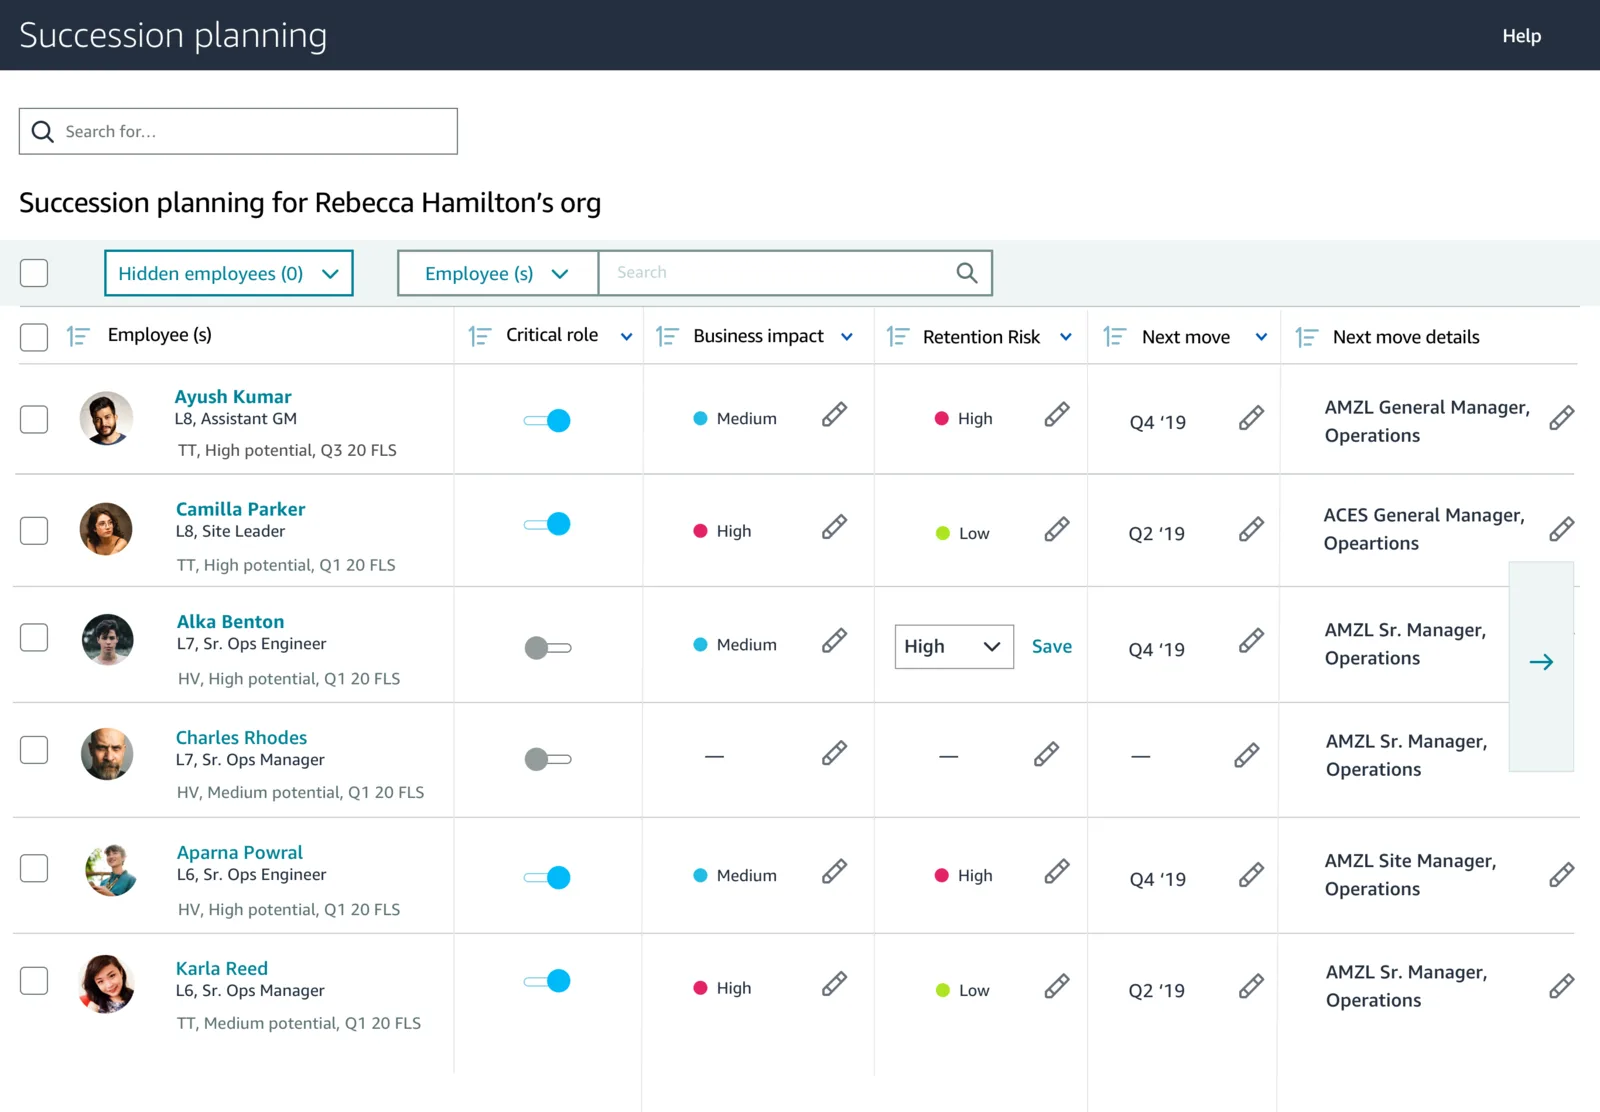
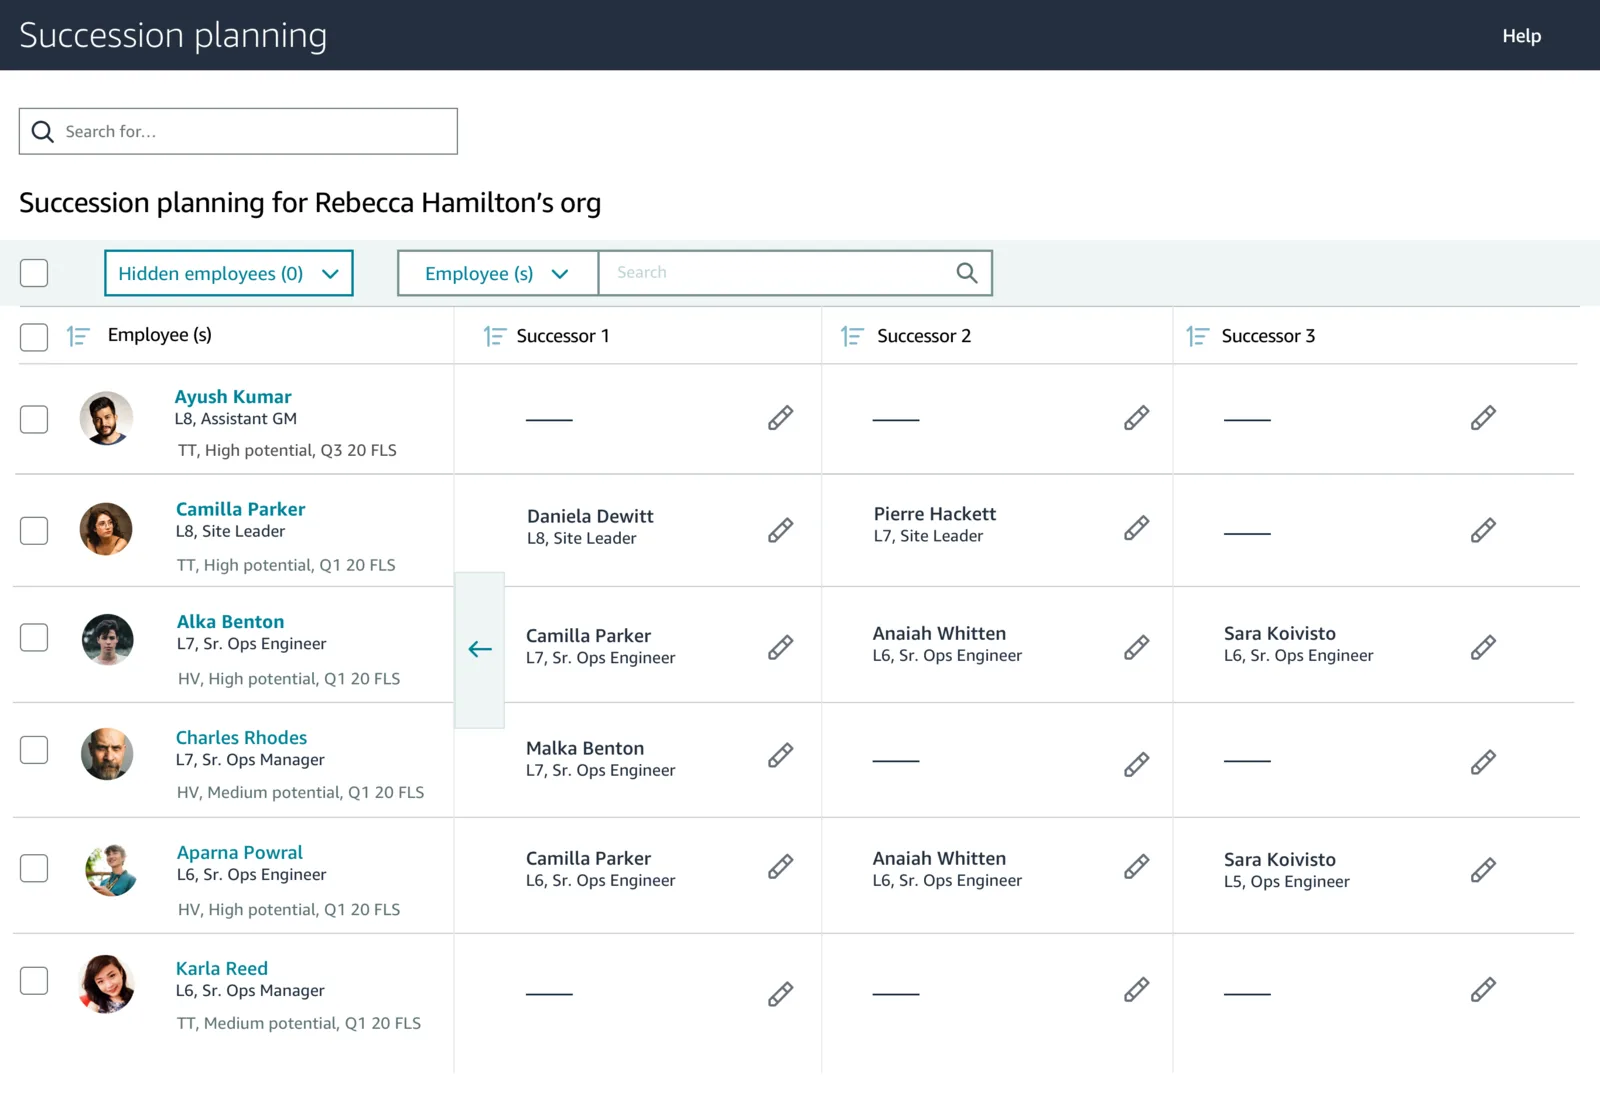
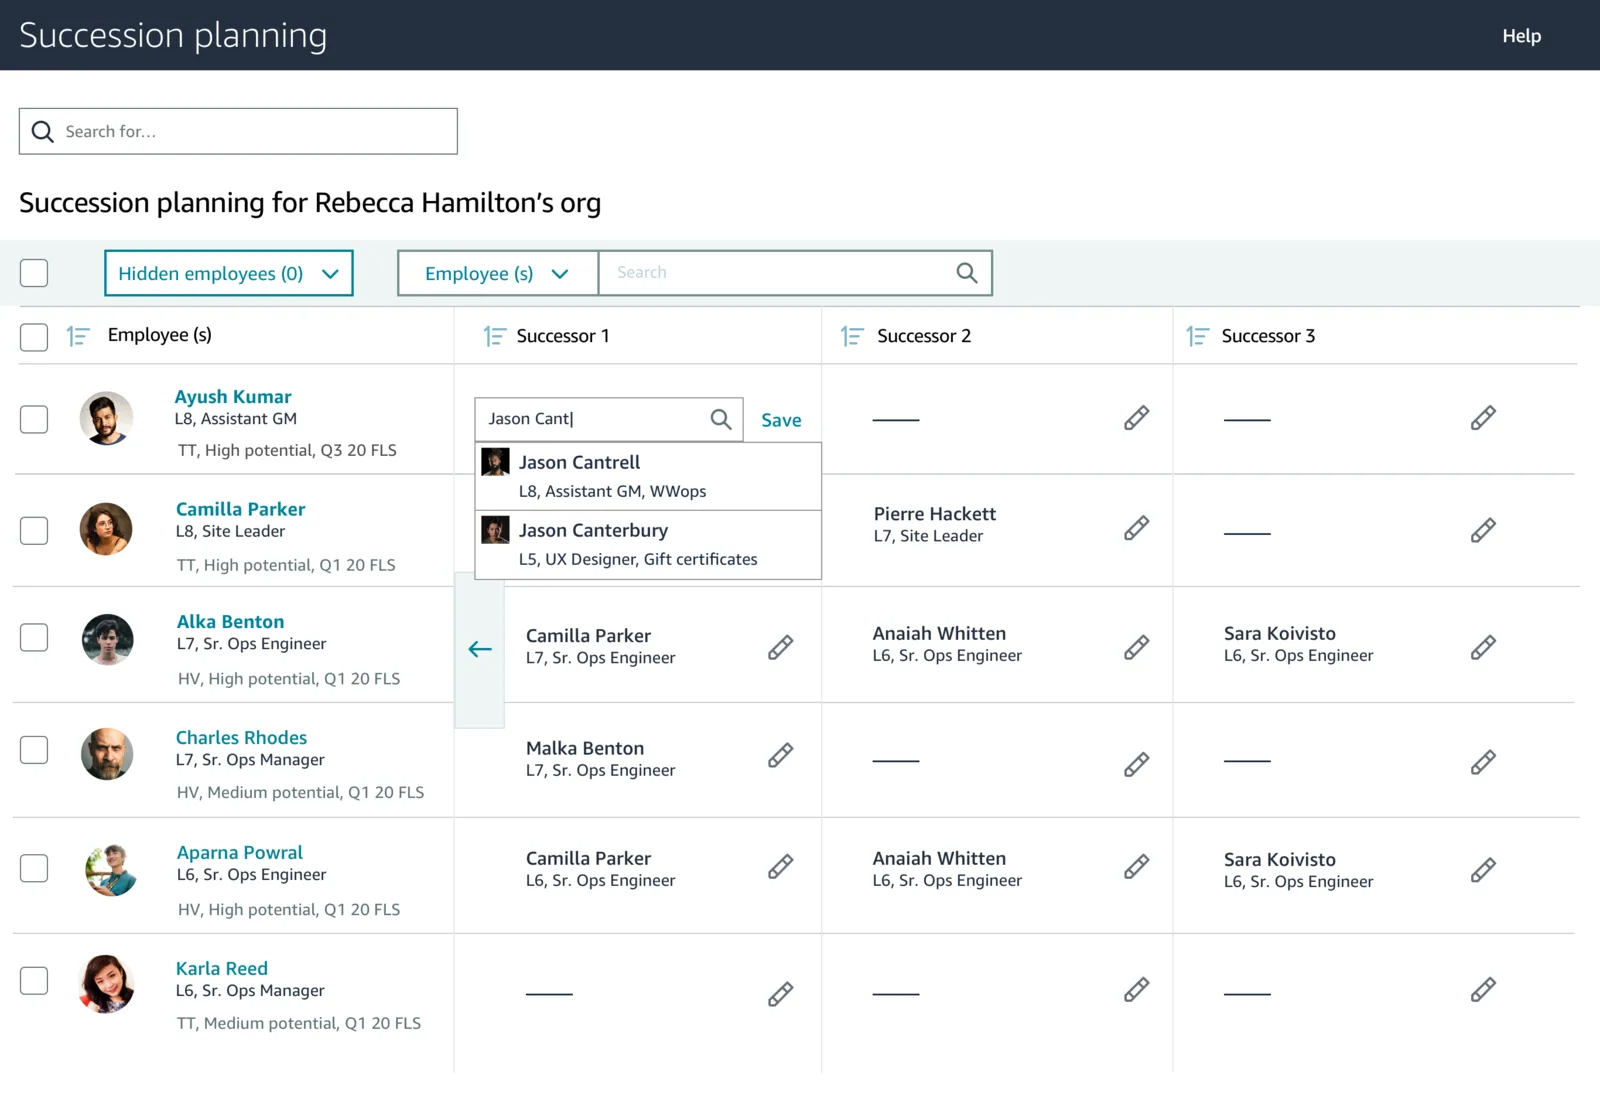
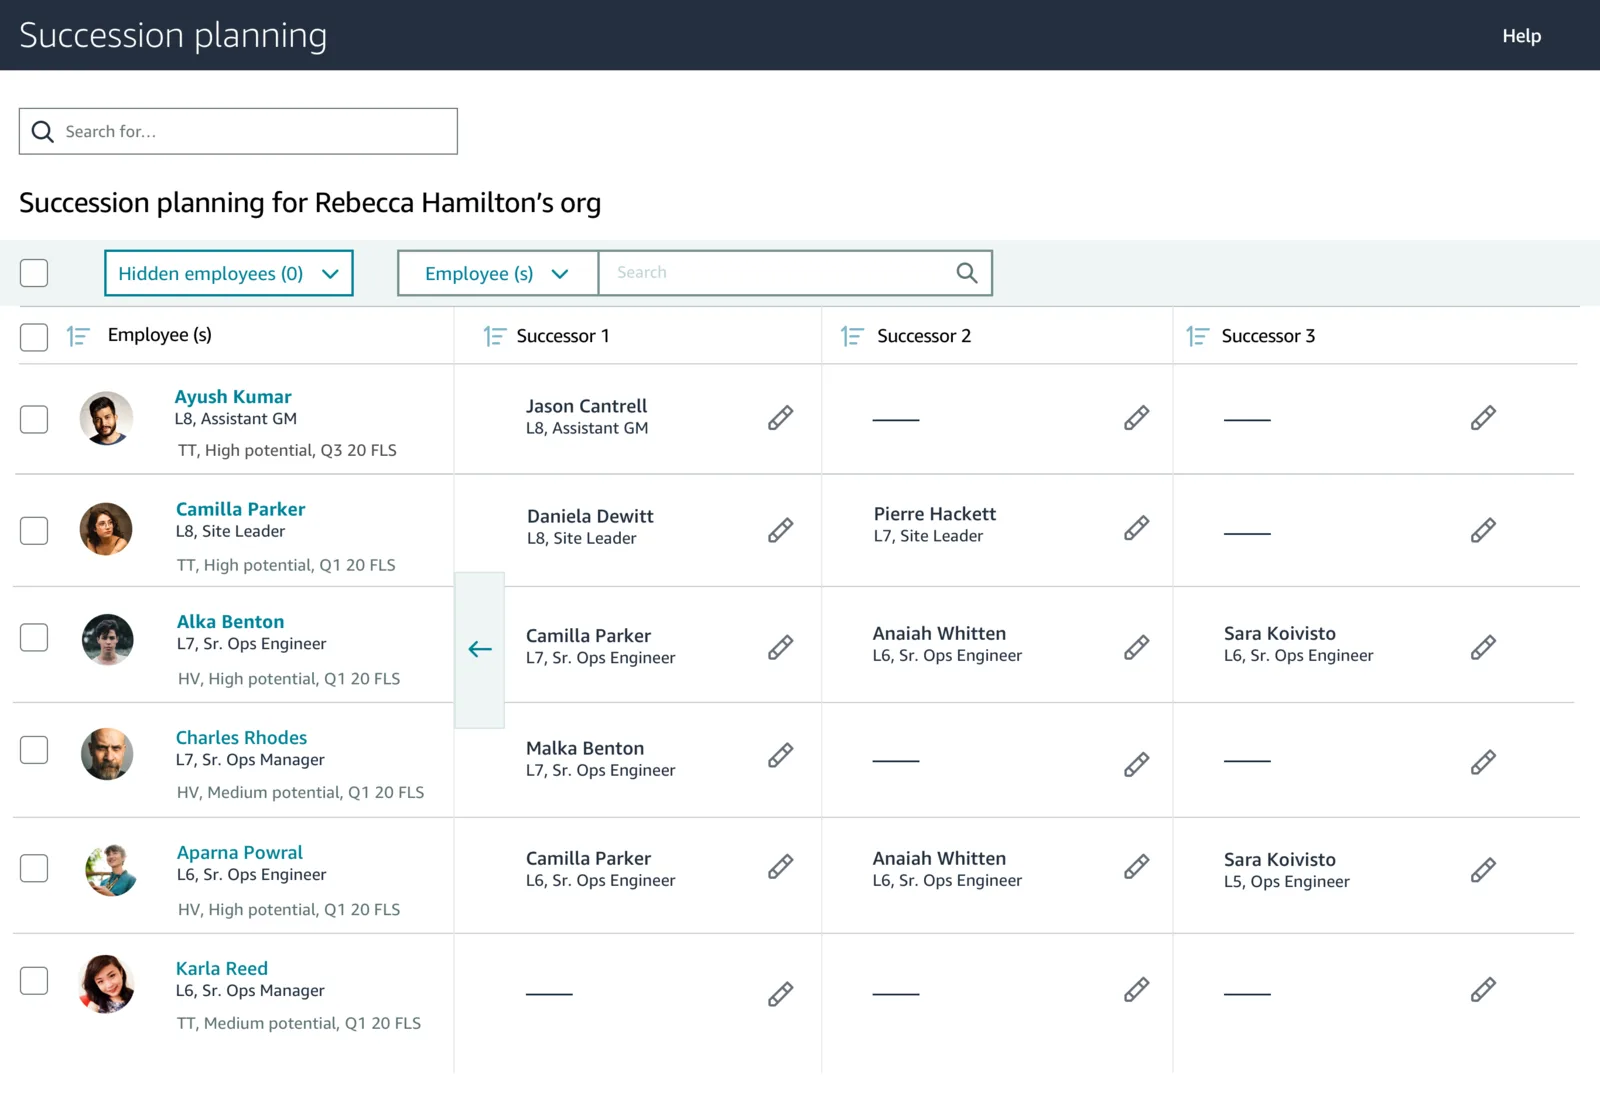
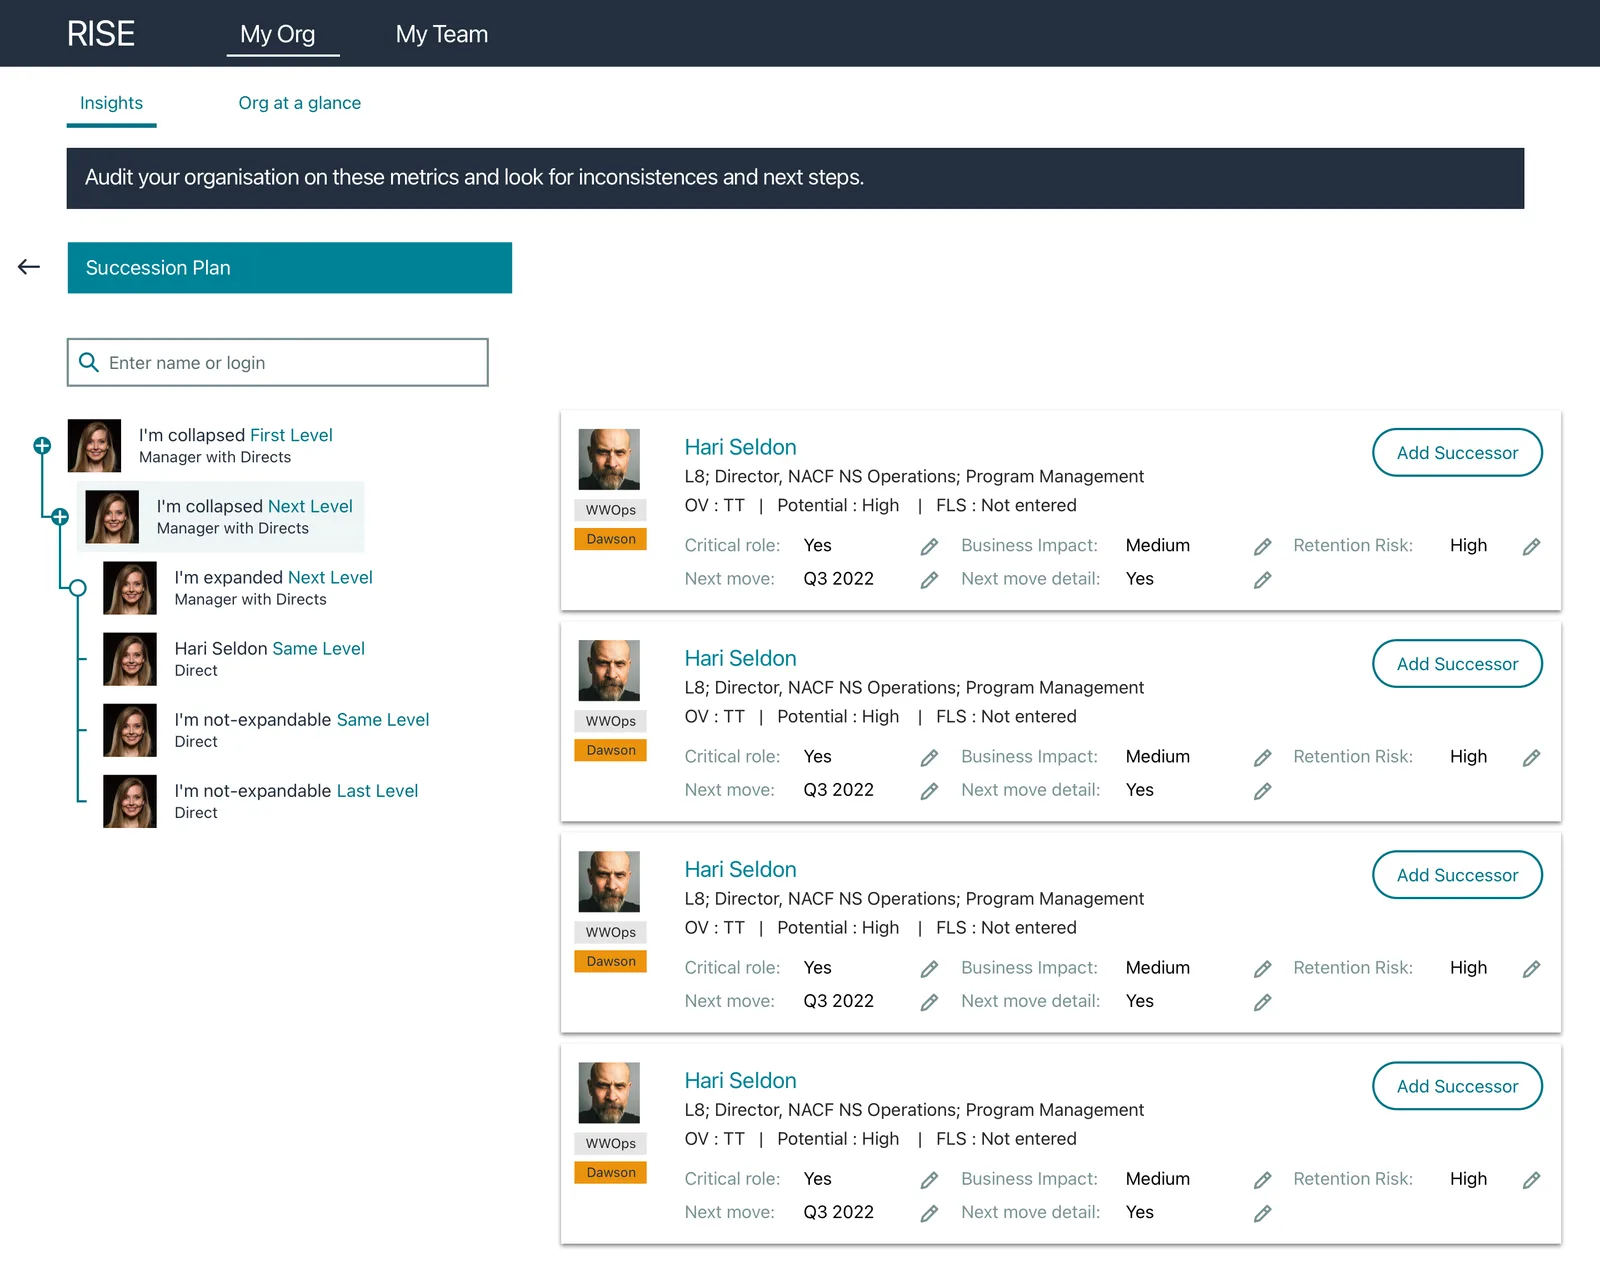
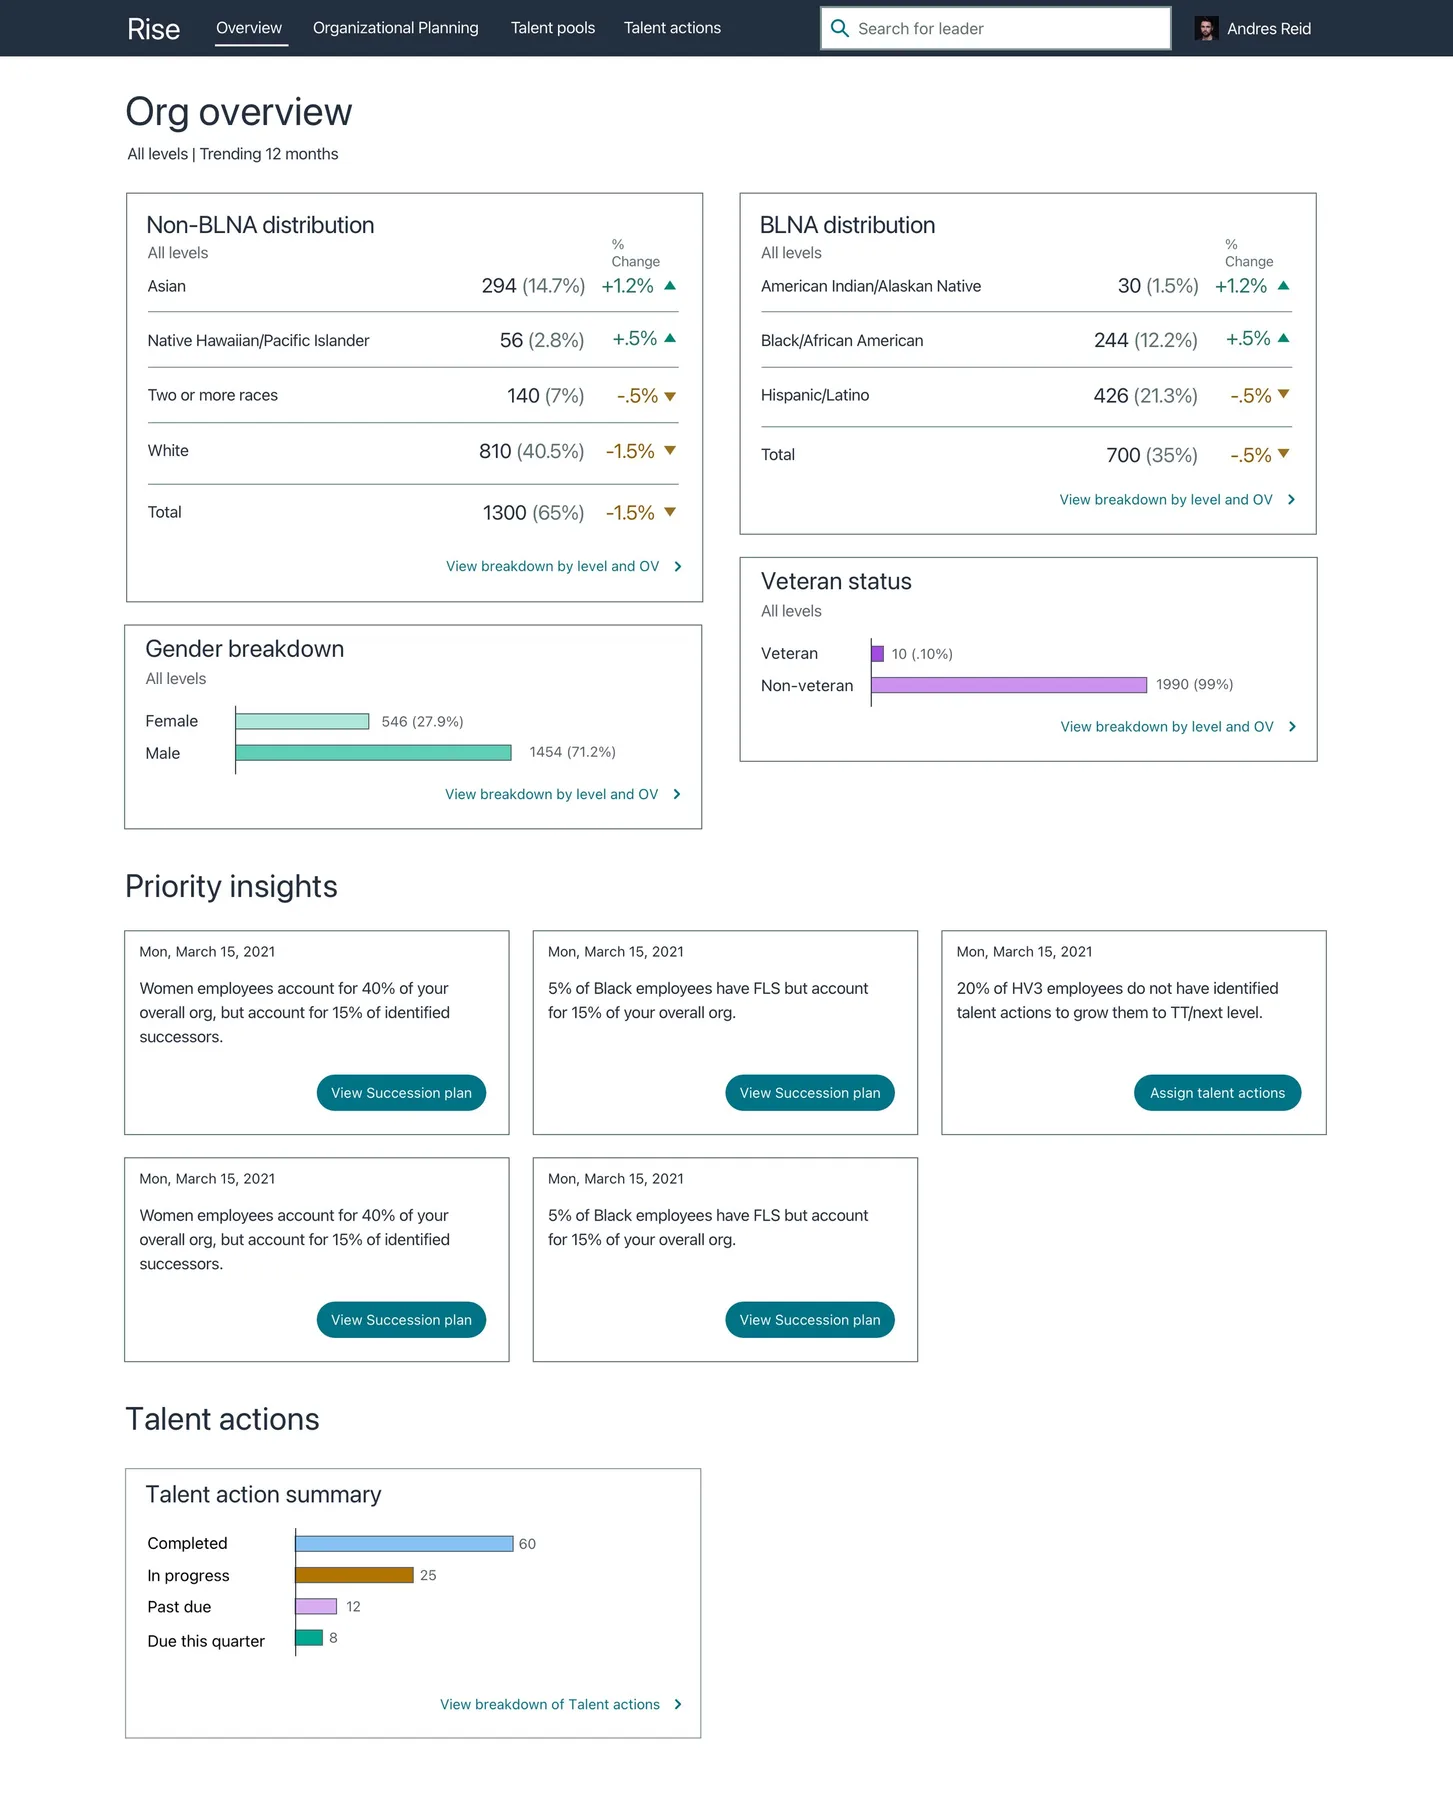
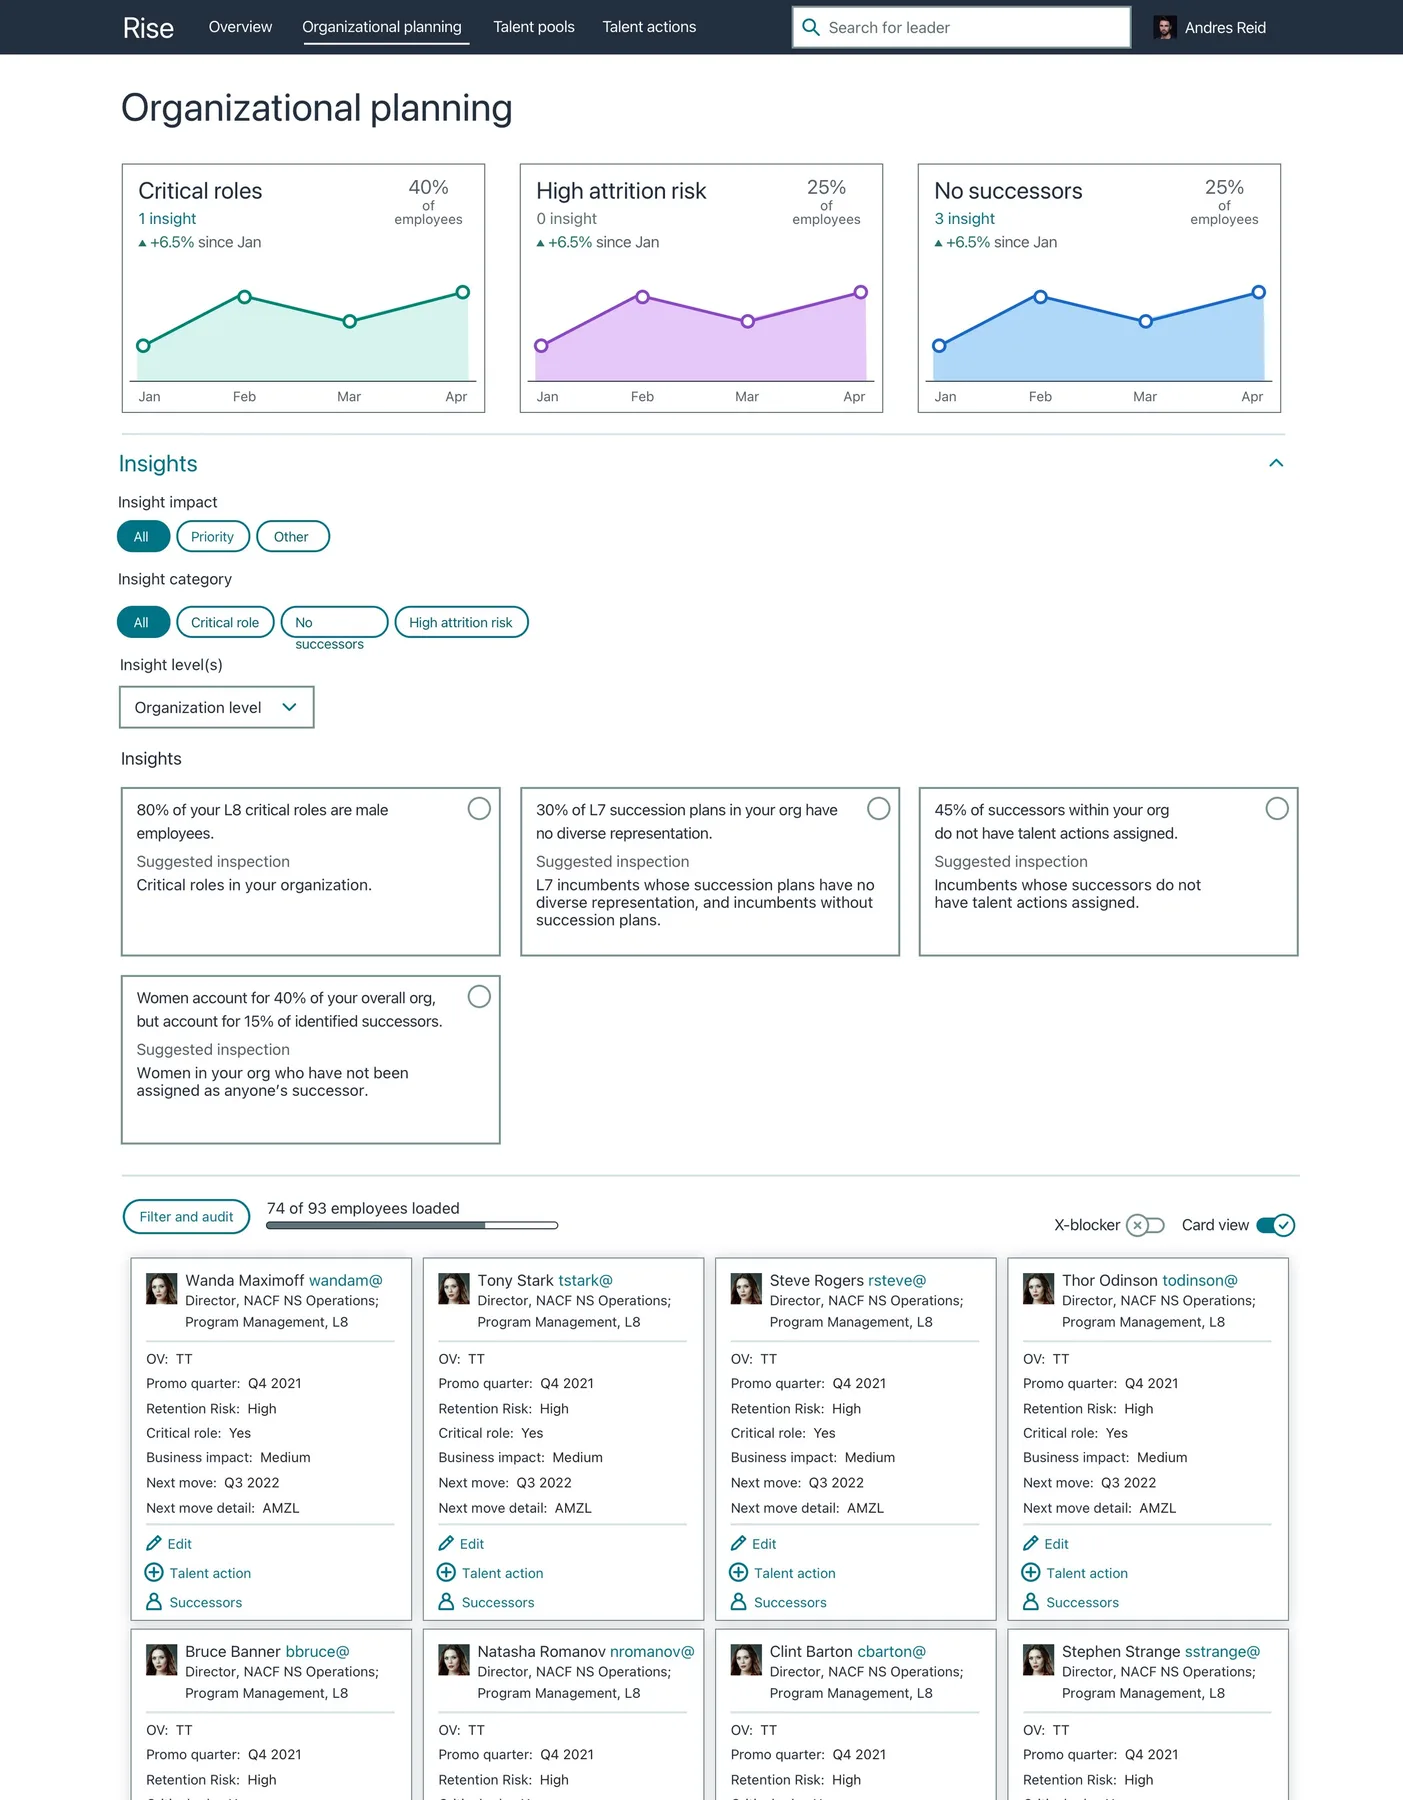
Succession planning — naming in advance who would take over an important job — was a box-ticking exercise done once a year in offline spreadsheets. The data was out of date the moment the file was saved. Rise made it live: who might leave, who is ready for more, which jobs have nobody behind them, and the action to fix it one click away.
Bias, surfaced. One VP discovered women were 48% of his organisation but only 15% of the people named as successors — and got a shortlist of women already performing at the next level.
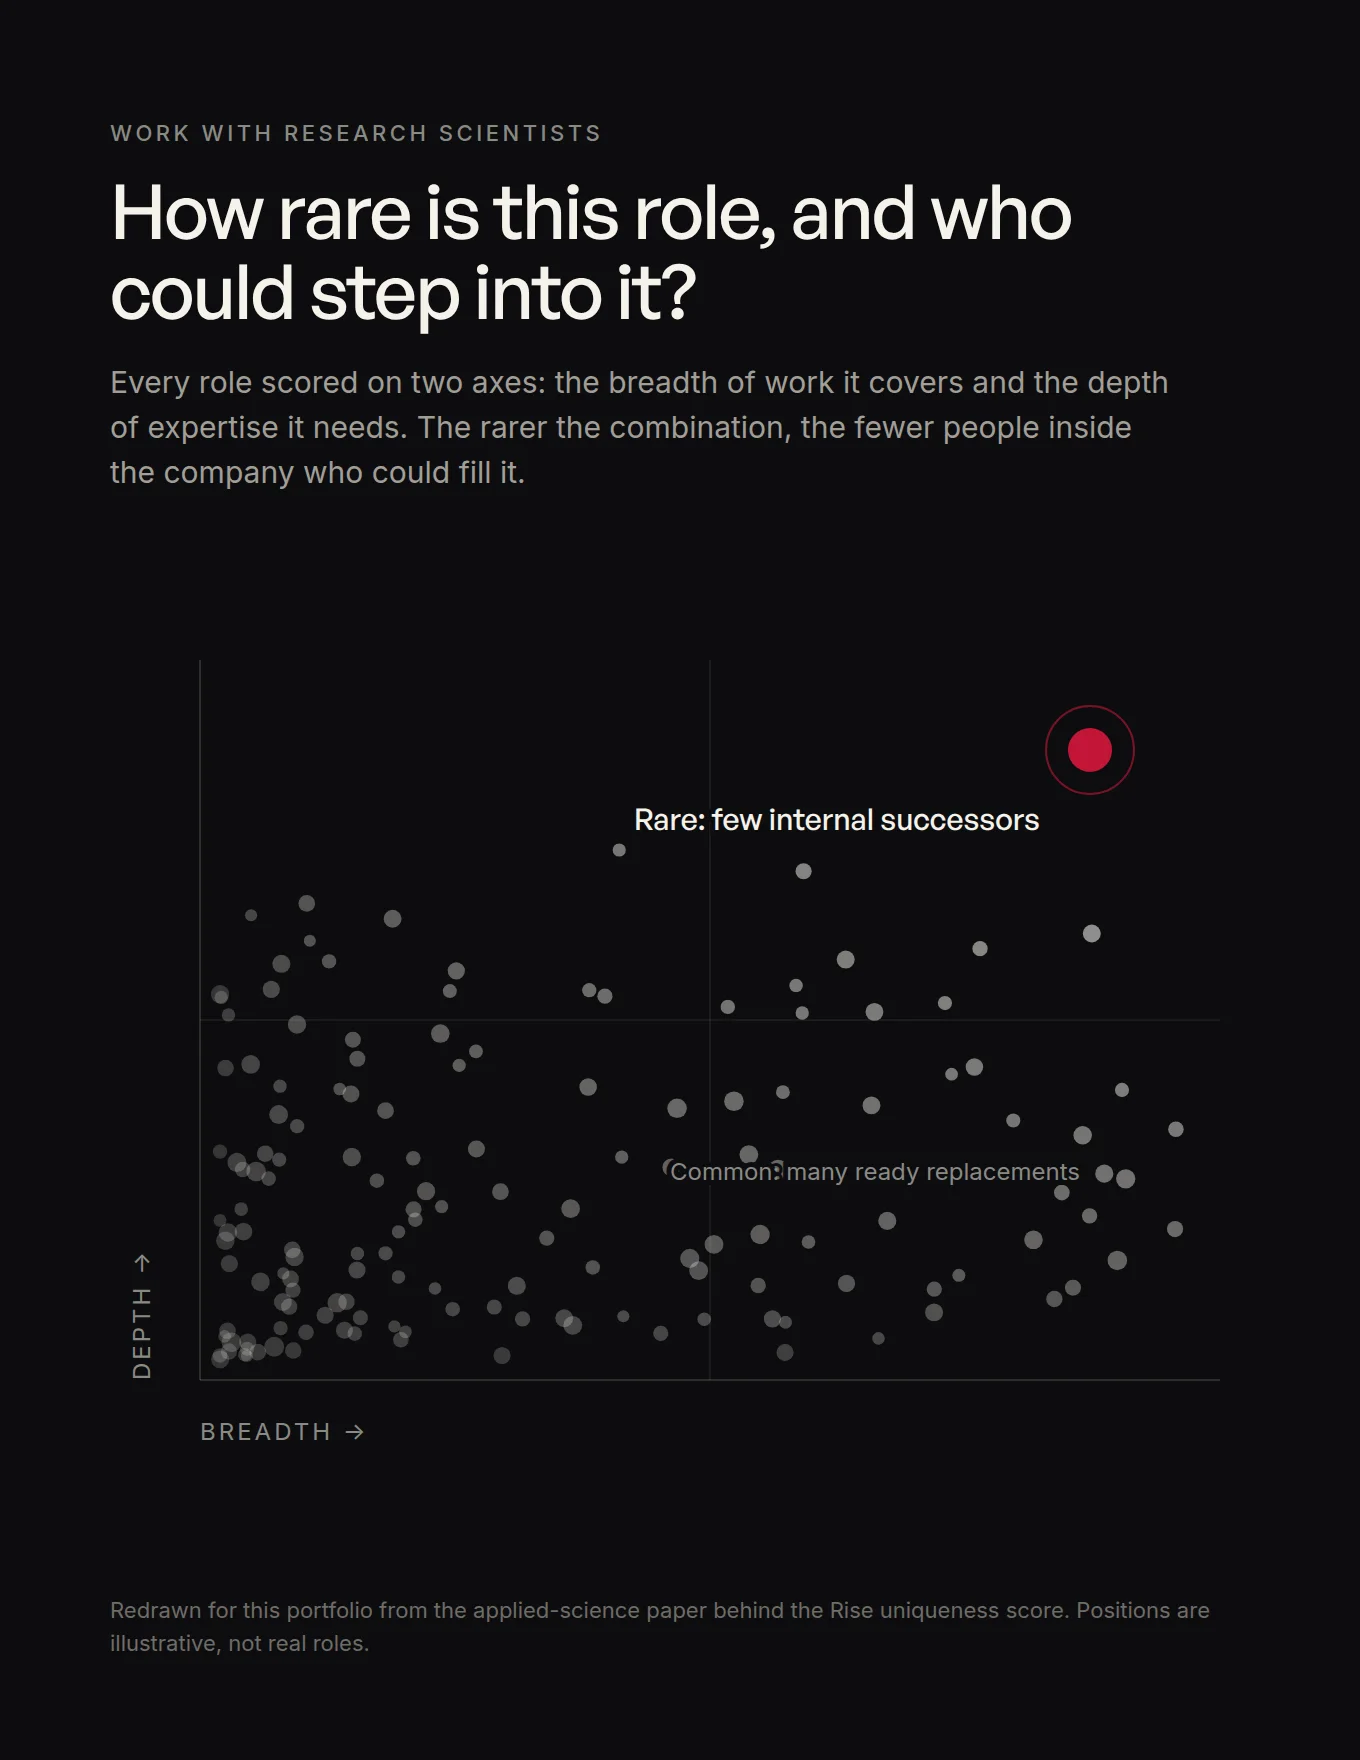
Uniqueness scores. Built with Amazon’s research scientists to find the jobs where one person leaving would stop the work, and get someone ready behind them.
Rise: the state of an organisation at a glance, with the action to take at the centre
Moved
FLUID · MOVING PEOPLE BETWEEN JOBS
The one-click transfer.
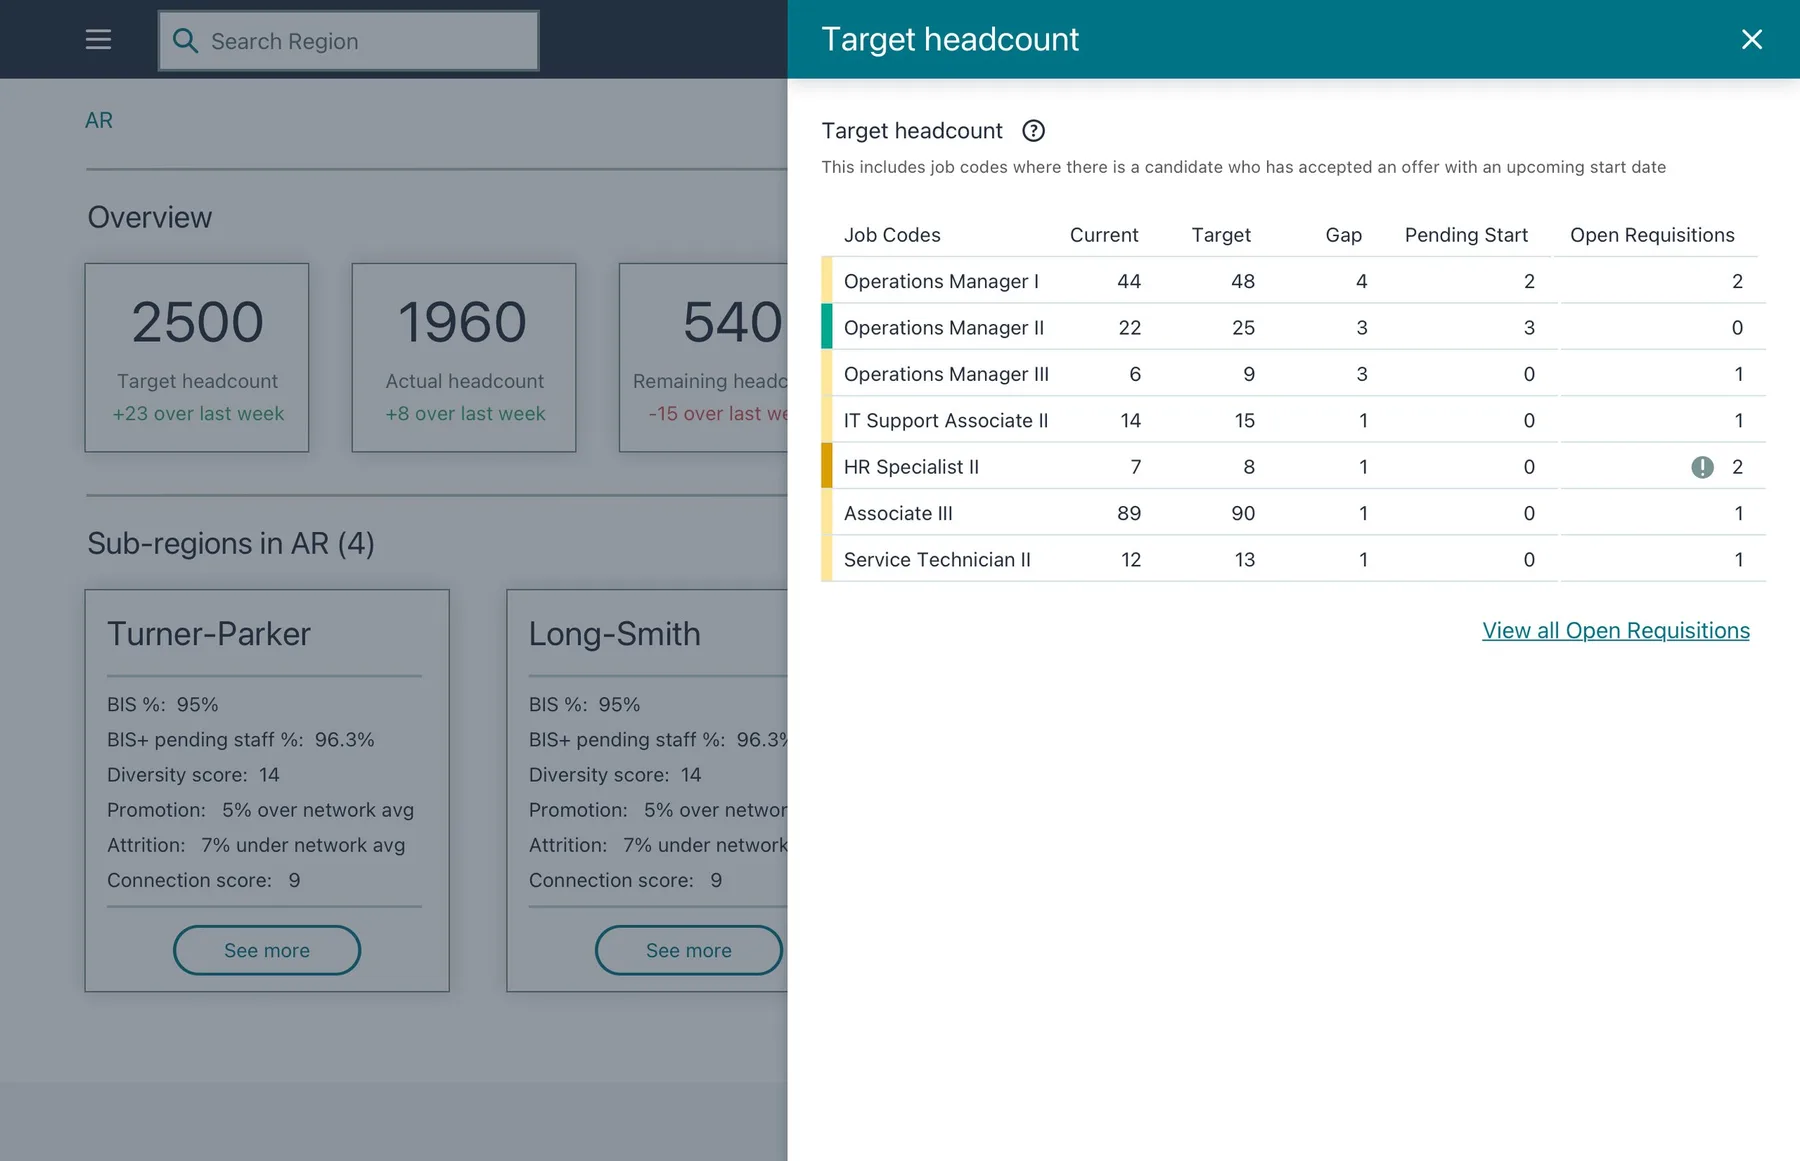
The payoff of the whole system. Fluid spots a staffing shortfall before it happens, building by building, ranks the people who fit the opening, and handles the paperwork that used to take 8 people and 48 days.
A whole region at once. How many people each building should have, against how many it will actually have.
One click. Most transfers approve with a single action.
<24hTO FILL A ROLE, DOWN FROM 48 DAYS
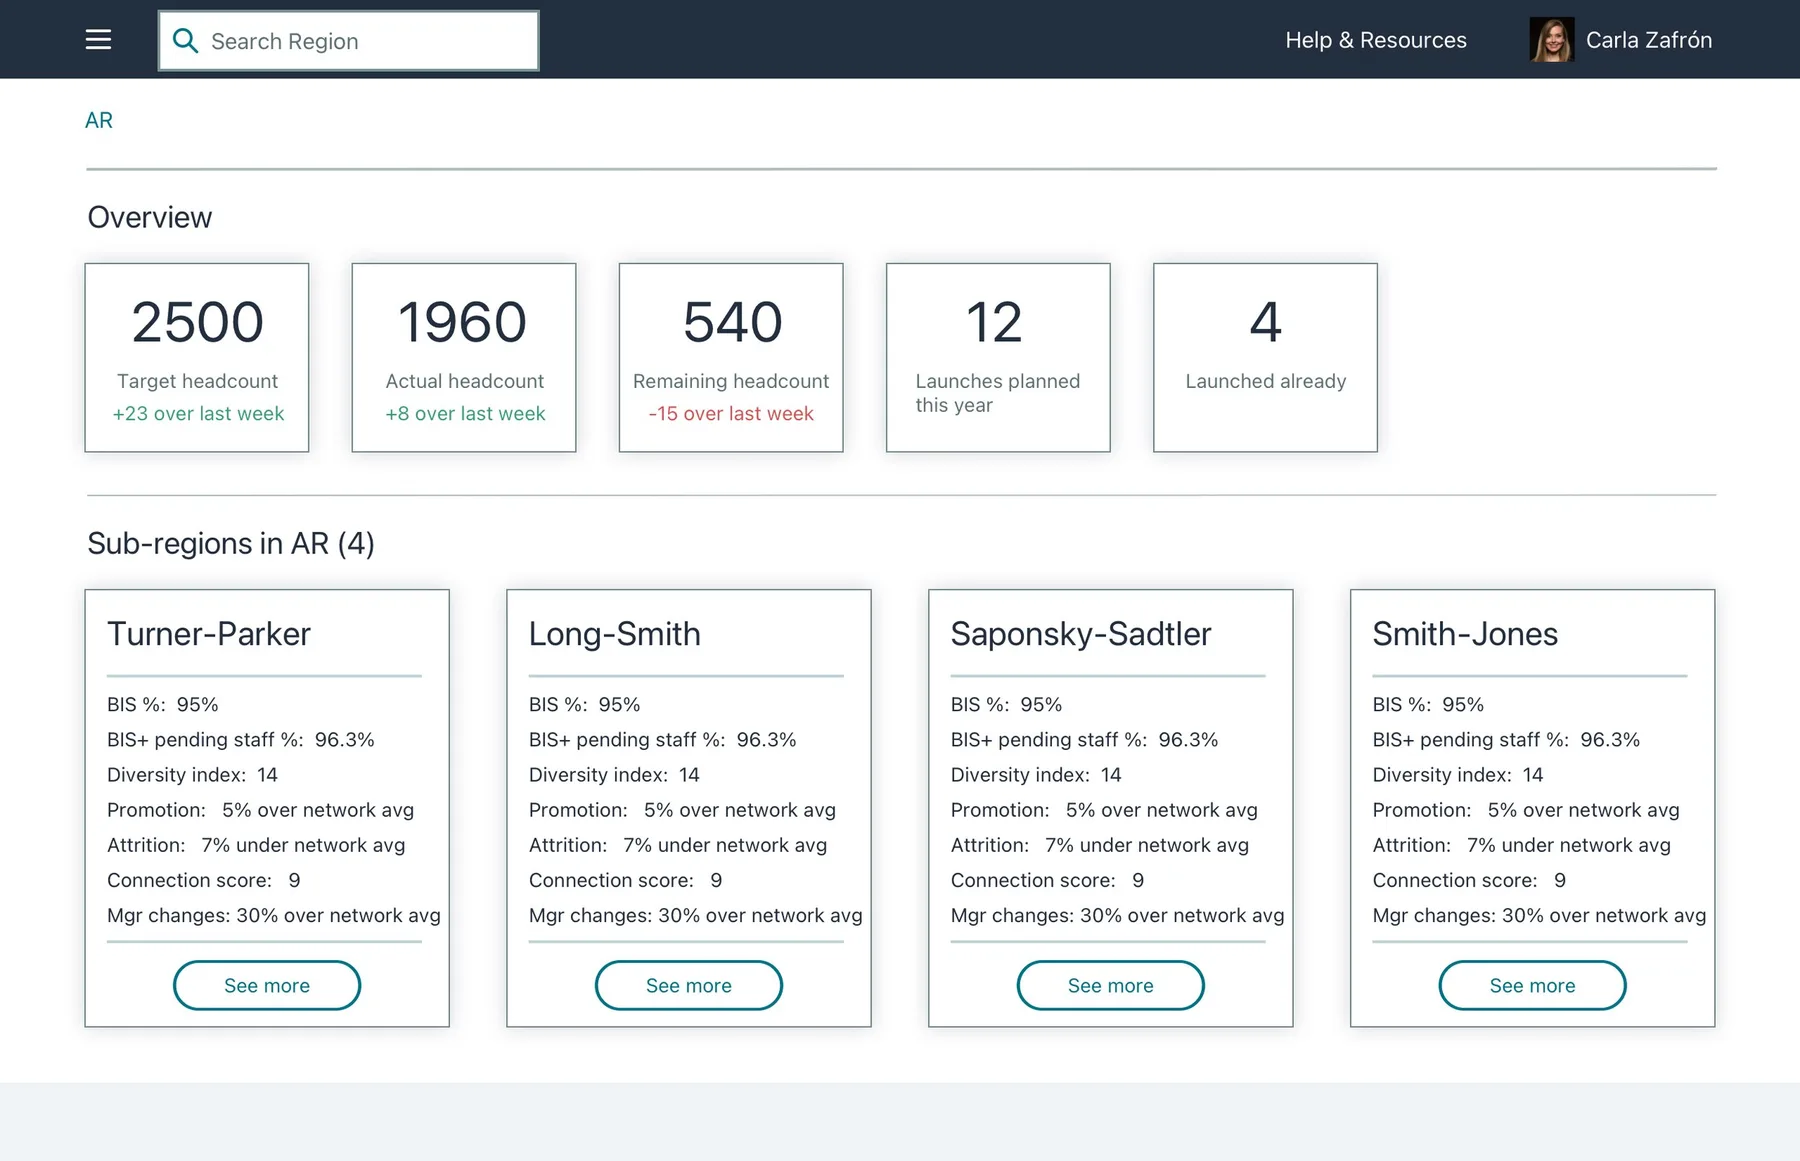
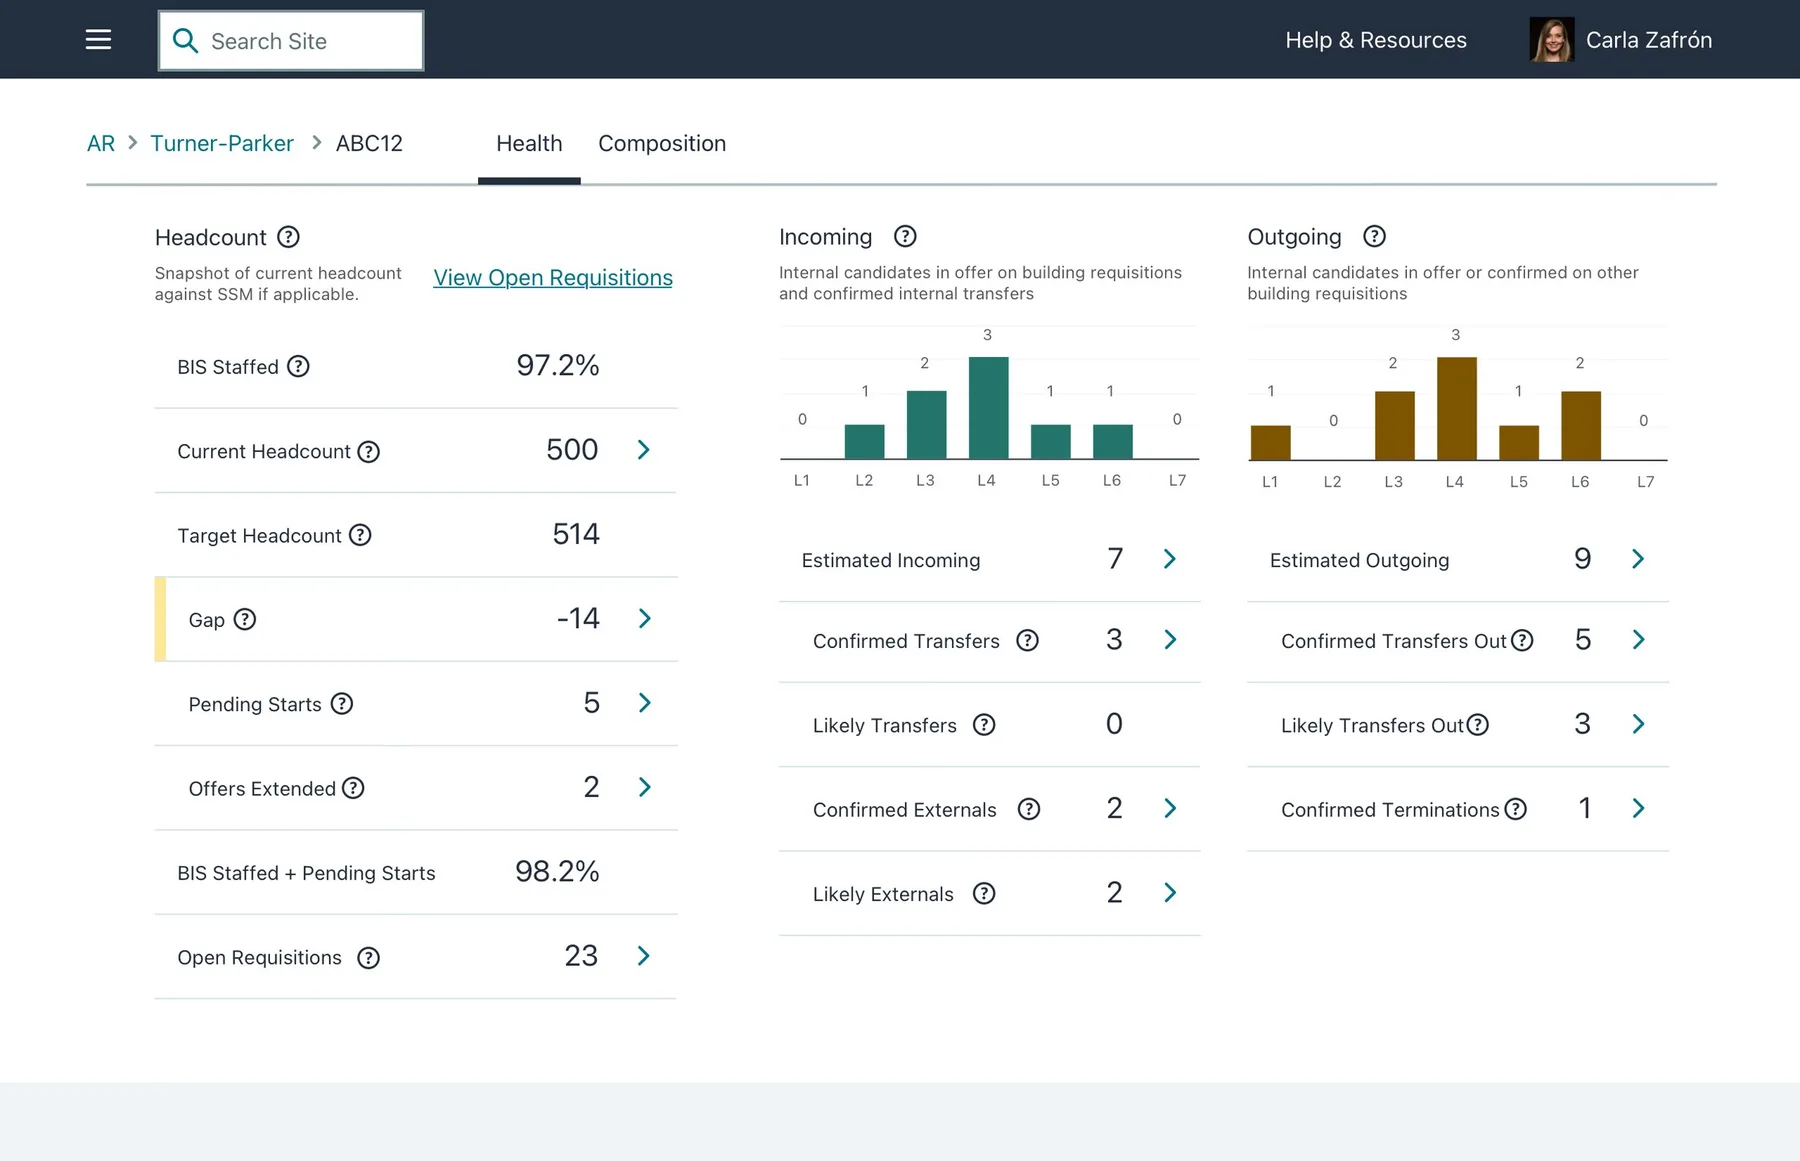
ONE TRANSFER, BEFORE AND AFTER
Forty-eight days to move one person.
Eight approvals across forty systems turned a routine move into a relay of spreadsheets and inboxes, with somebody retyping the same history at every stop.
The same decision, completed in one click.
Profile carried the record, Search found the person, Rise made the risk visible, and Fluid moved them, with nobody rebuilding the story at each handoff.
Less administration. More leadership.
I ran the user testing, the keyboard retesting and the element-by-element accessibility audit, then stayed with engineering through the build so the speed held up in production.
Internal transfer · Ready to move
48days
<24hrole filled
HR partnerSiteRegionFinanceLegalOpsHRLeader
ApproveDone
$10M+run-rate savings
700+hours saved monthly
100%WCAG 2.1 AA
Triple digitgrowth, month on month
WHAT LEADERS SAW
Three products.
Three moments the system became real.
Three specific moments when a leader saw time, action or bias differently.
01 EXECUTIVE TALENT PROFILE · TIME RETURNED
“The Executive Talent Profile is a life saver. We no longer spend hours to days collecting and analyzing employee insights. We can pull this information in real time.”
VP, Worldwide Operations
Executive profileLIVEReal-time
02 FLUID · ACTION COMPRESSED
“I completed an internal transfer in less than 24 hours. All I had to do was click Approve. I don’t even think about staffing levels anymore.”
VP, Global Delivery Services
ApproveDone
<24h
03 RISE · BIAS MADE VISIBLE
“Rise showed that women were 48% of my organization but only 15% of identified successors, and then showed us who was already performing at the next level.”
VP, Delivery Operations
Organization48%
Successors15%
Next-level shortlist →
Everything shipped fully accessible: every control reachable without a mouse, focus moving in a sensible order, words behind every image, and nothing signalled by colour alone.
WHAT I’D DO DIFFERENTLY
Three things I got wrong.
Every number above is real. So is this. Four greenfield products for a million people did not run clean. Two of these are versions of the same mistake — I assumed other people lived inside this software the way my team did. The third is about knowing when to stop.
-
01
I designed for my calendar, not theirs.
My team had Talent Search open every day, so we built as though finding people were a daily act. It isn’t. Leaders plan their orgs in bursts tied to the quarter, and between those windows there was no reason to open it. Adoption was slow, then moved sharply once the first planning cycle came round — which told me the product was right and my model of when it mattered was wrong. I now ask what a user’s year looks like before I ask what their screen should do.
-
02
I let “the most important thing” be settled too early.
Talent Profile is one page about one person, so it lives or dies on what earns a place on it. I found that out by asking — and the answer moved with who I asked. A site manager, an HR partner and a recruiter each named a different top three, so every time the research widened the page was rebuilt. The mistake wasn’t asking. It was treating “what matters most” as one answer I hadn’t found yet, rather than something that varies by role and should have been designed that way from the start.
-
03
I’d kill a good idea faster.
There was real appetite for a fifth product — Talent Pool, where anyone could assemble and keep their own group of people out of Talent Search. It was a reasonable idea, genuinely wanted, and would have been a fifth thing to staff, ship and maintain. We cut it back and folded the useful part into products that already existed. I still think that was the right call. I would just make it sooner: a request for a new product is usually a feature wearing a costume.
There are shorter versions of this same project.
THE CRAFT, UP CLOSE
One screen, and the decisions inside it.
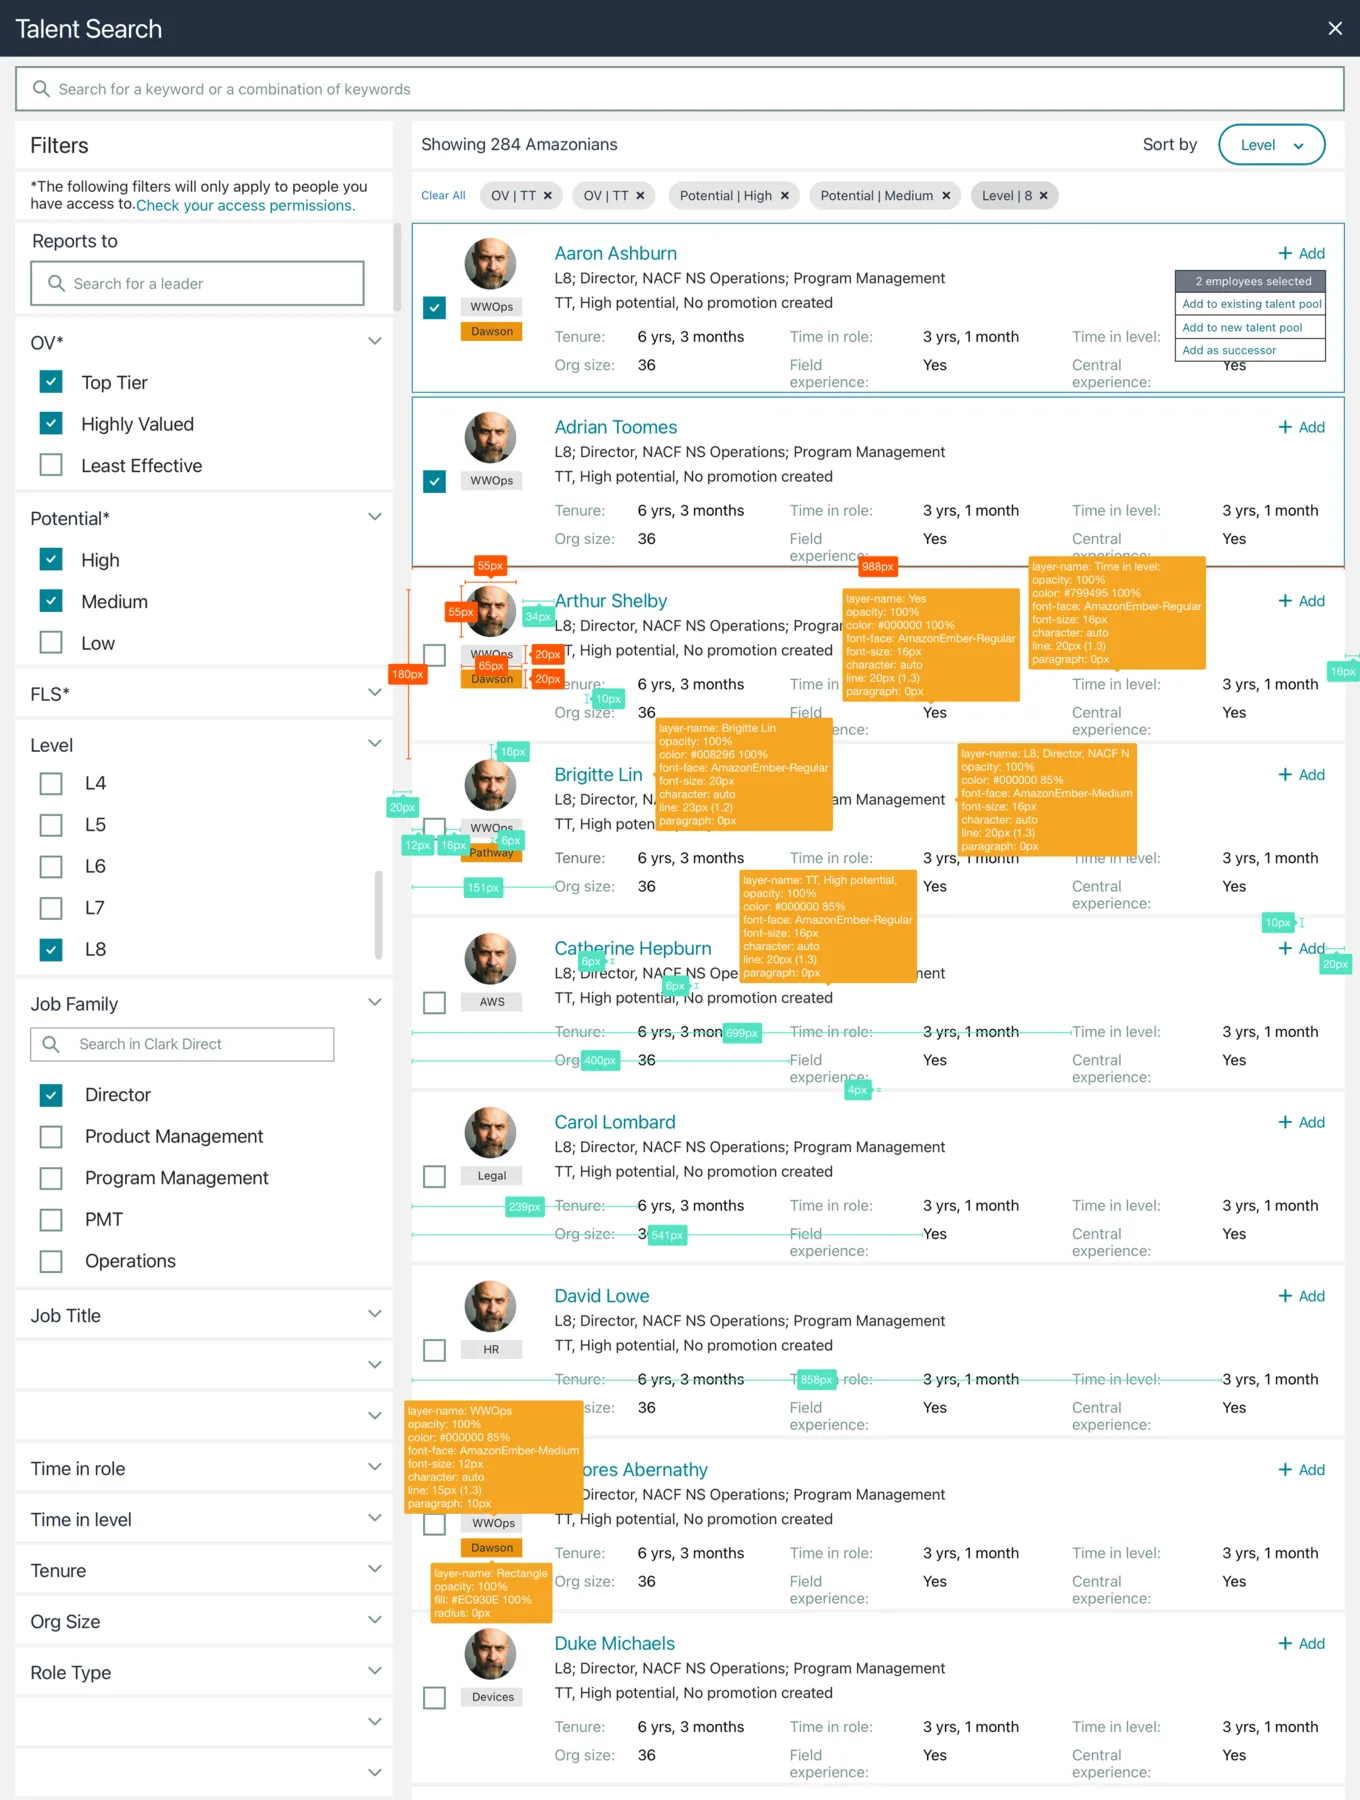
Systems arguments are easy to make in prose. This is a real shipped screen at full size — Fluid’s regional view, where a leader sees whether a whole region is about to run short. Click it to zoom. Four of the decisions that produced it are on the right.
Click to zoom
- SpecificationDrawn, then dimensioned.
There was no component kit to appeal to, so every element carries its own font-face, size, line height, colour and opacity. This is the artifact that let four products ship on four schedules and still look like one thing — and the one a junior designer could read to see what “finished” meant here.
- DensitySix fields per result, fixed order.
Tenure, time in role, time in level, org size, field and central experience — same sequence on all 284 rows, so the eye scans down a column rather than re-reading each result. Repeating the labels costs space and buys comparison.
- Progressive disclosureTen filter groups, most of them shut.
Only the four in use are expanded, and every applied filter reappears as a removable chip beside the result count. At this scale the anxiety is not too little control, it is not knowing which controls are currently on.
- PermissionThe access rule is stated, not hidden.
“These filters only apply to people you have access to” sits at the top of the rail with a link to check your own permissions. A search over a million colleagues has to be honest about what it is not showing you, or every empty result reads as an answer.